| Center for Energy, Environmental, and Economic Systems Analysis (CEEESA) |
Research Areas:
Energy, Environment, and
Economics
National and Homeland
Security
Infrastructure Assurance
Emergency Preparedness
Social Dynamics
Policy Analysis
Core Capabilities:
Systems Analysis
Modeling, Simulation, and
Visualization
Complex Adaptive Systems
Decision Support and Risk
Management
Information Sciences
Assisting The World Bank in Analyzing Turkey's Greenhouse Gas Mitigation Options
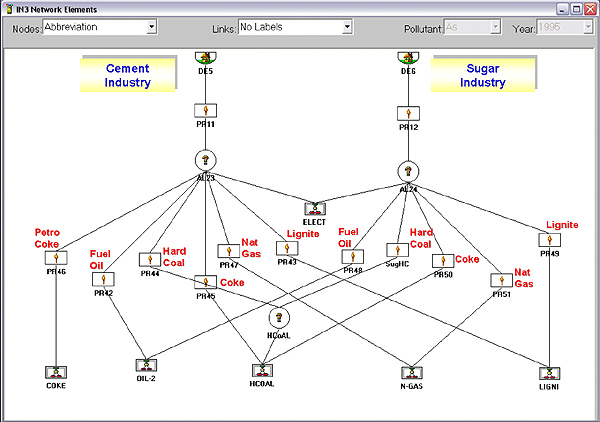
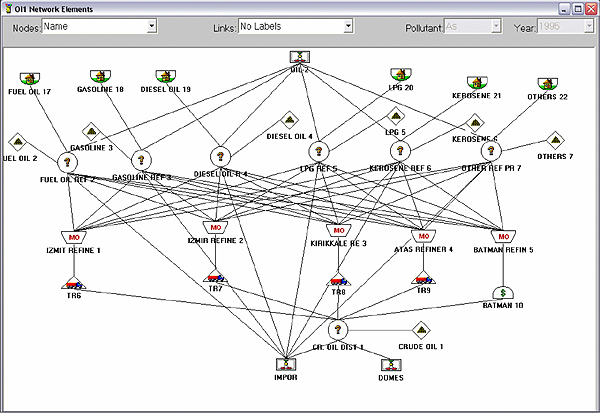
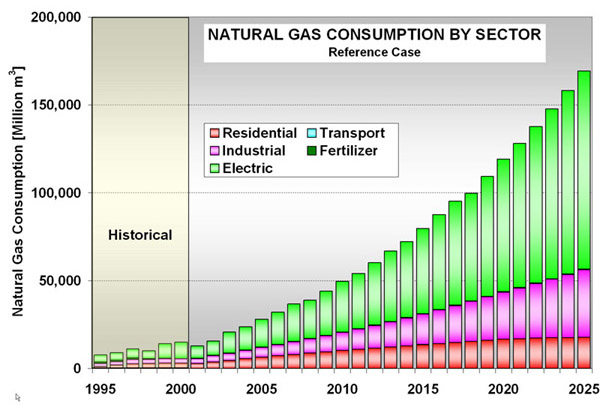
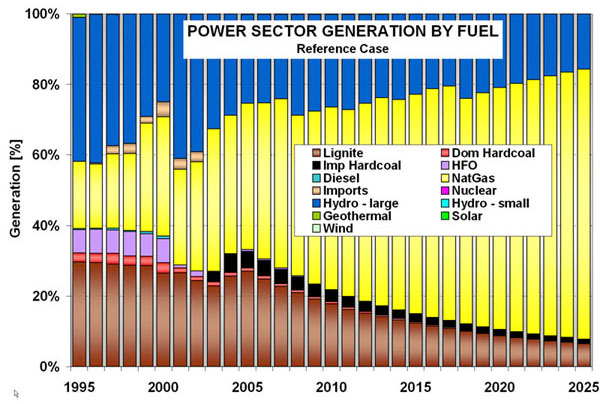
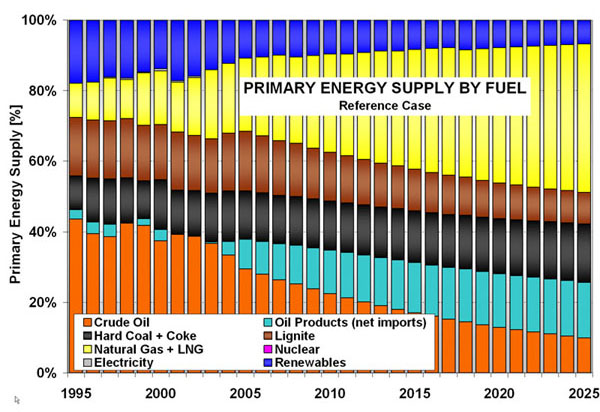
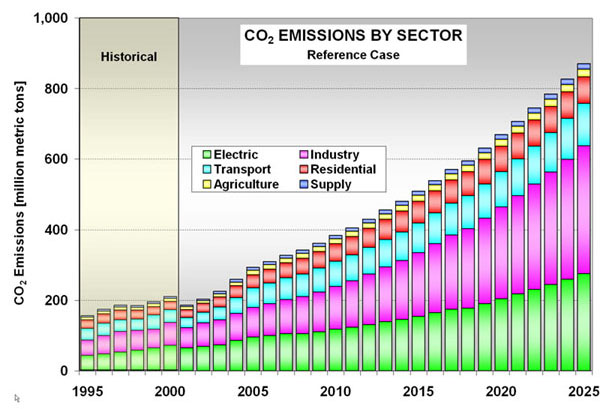
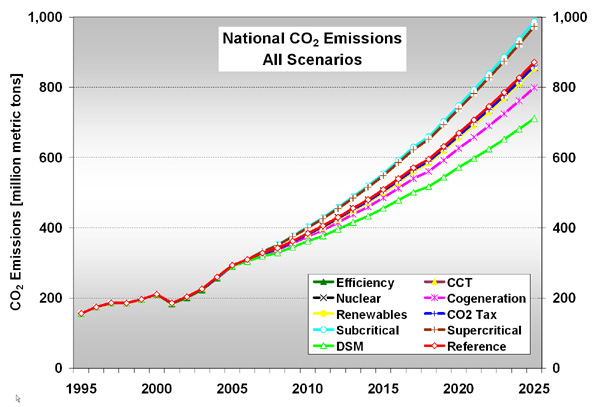
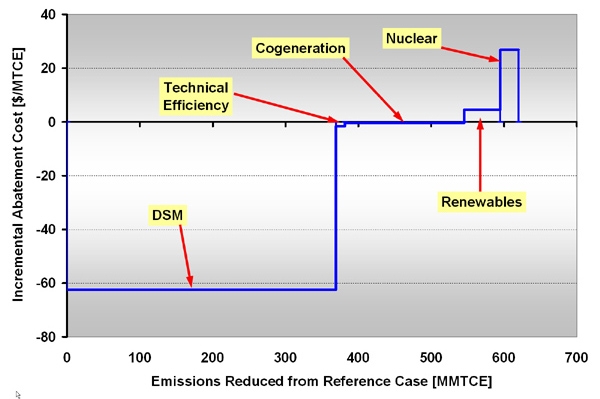
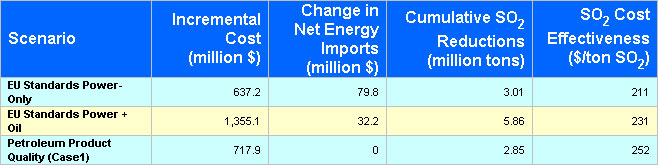
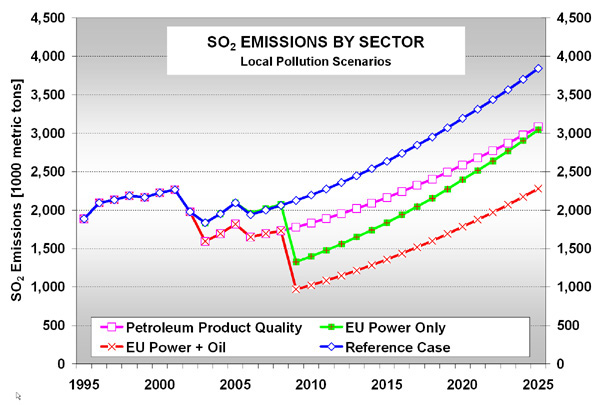
Turkey Overall ENPEP-BALANCE Network Methodology: Throughout the analysis, CEEESA closely collaborated with a number of Turkish institutions. CEEESA's latest version of ENPEP-BALANCE played a key role in the analysis. The Model for Analysis of Energy Demand (MAED) was used to project future energy and electricity demand, the Wien Automatic System Planning Package (WASP) was used to obtain information on the electricity generation expansion, and the ENPEP-BALANCE model projected future fossil and nonfossil energy flows in Turkey from energy extraction through end use across all sectors. In addition, the VALORAGUA model was used to evaluate the operation of the hydro portion of the electric power system. Turkey Example for Industrial Representation in ENPEP-BALANCE Click on the figures above and below to see the general sectoral network of the Turkish energy system representation in ENPEP-BALANCE. Two additional screens show examples for the industrial sector (cement and sugar industries) as well as the oil refining sector that includes all five existing refineries in Turkey. Turkey Oil Sector Representation in ENPEP-BALANCE Scenarios: The analysis included a Reference Case as well as a number of alternative scenarios. Scenarios are generally divided into (a) greenhouse gas (GHG) Reduction Scenarios and (b) Local Pollution Reduction Scenarios that are targeting mostly emissions of particulate matter (PM), sulfur dioxide (SO2), and nitrogen oxides (NOX). GHG Reduction Scenarios include (1) technical efficiency improvements in existing power generating units, (2) clean coal technology for power generation, (3) constrained gas supply combined with the use of new sub-critical and super-critical coal-fired power stations, (4) nuclear power, (5) demand-side management, (6) expanded use of cogeneration in the industrial sector, (7) expanded use of renewables for electricity generation, and (8) carbon tax. The Local Pollution Reduction Scenarios include (1) impacts of petroleum product quality improvements and (2) the implementation of European Union (EU) Standards for the power sector and the oil sector. Results of Analysis: Results were presented at a World Bank seminar in Ankara in June 2002. The Final Report was delivered in September 2002. Below are excerpts from the Executive Summary. Click here to download the Executive Summary. For the full report, contact CEEESA Reference Case Final Energy Consumption: Based on the demand forecast from MAED, total final energy consumption grows at an average rate of 5.9% per year from 65.5 mtoe (2000) to 273.5 mtoe (2025). Average annual growth rates vary by sector, with industry having the highest rate at 7.6%, followed by the transportation sector with 5.0%. Over 2000–2025, industrial consumption increases from 23.9 to 148.9 mtoe, increasing its share from 36% to 54% (see figure below). In terms of final energy by fuel, hard coal/coke increase their share slightly from 13% to 18%, lignite holds steady at 6%, electricity grows from 17% to 24%, oil products decline from 42% to 29%, and natural gas increases from 7% to 17% between 2000 and 2025. The model also projects fuel mixes for each of the consumer groups or demand sectors. Turkey's Projected Final Energy Consumption Through 2025 by Sector - Reference Case Reference Case Natural Gas Consumption: Total natural gas consumption is projected to increase at an annual rate of 9.6% from 15.0 to 169.4 billion cubic meters (bcm) over 2000–2025. Power sector gas demand is one of the main drivers for this projected growth and will account for 112.8 bcm or 67% of total gas consumption in 2025 (up from 9.3 bcm in 2000). Industrial demand is the fastest-growing market segment (11.5% annually) with gas expanding from 2.5 bcm to 38.4 bcm during 2000–2025 and eventually accounting for 23% of total gas consumption (see figure below). Projected natural gas consumption levels for the industrial, residential, and electric power sectors are compared with the latest forecasts by the Turkish gas company (BOTAS). For the industrial sector, ENPEP-BALANCE is projecting a more delayed market adoption; nevertheless, by 2015, the ENPEP projection is within 9% of the BOTAS forecast. A somewhat different picture emerges for the residential sector, where, up to 2012, projected ENPEP gas consumption is somewhat lower than the BOTAS values (within 1% by 2012), but then starts to be above the BOTAS values. For the electric sector, ENPEP-BALANCE tends to project lower values until 2008 and then higher values as a consequence of the aggressive gas-based power system expansion. Turkey's Projected Natural Gas Consumption by Sector Through 2025- Reference Case Reference Case Electric Power Generation: New capacity additions are projected to total about 108 GW by 2025. WASP results indicate that the majority of the load growth is met with natural gas-fired generation (see figure below). By 2025, gas-fired units represent 67% (93 GW) of the installed generating capacity and account for 77% of total generation (588 of 768 TWh). Turkey's Projected Power Generation Mix by Fuel Through 2025 - Reference Case Reference Case Primary Energy Supply: Primary energy supply is projected to increase from 64.5 mtoe (1995) to 332.0 mtoe (2025). Crude oil imports remain constant at 33.0 mtoe after 2004 when the domestic refineries are forecast to run into their processing capacity, resulting in a drop in crude oil share from 44% to 10% of total supplies. Once the refining capacity is reached, net imports of refined products quickly grow from 2.6 to 52.3 mtoe (2000–2025), accounting for about 16% of total supplies by 2025. Natural gas quickly increases its share from 10% (6.3 mtoe) in 1995 to 42% (139.8 mtoe) of total supplies in 2025 (see figure below). Although renewables double over 2000–2025, their share decreases from 14% in 2000 to 7% in 2025. Turkey's Projected Primary Energy Supply Mix Through 2025 - Reference Case Reference Case Energy Import Bill and Economic System Costs: Overall energy imports increase substantially from 37.1 mtoe (1995) to 275.2 mtoe (2025) and will bring Turkey’s energy import dependency to 83% by the end of the study period. While in 1995, crude oil accounted for the majority of imports (67%), gas imports are slated to take this position with 51% by 2025. Turkey’s total net energy import bill under the Reference Case is estimated to have a net present value (NPV) over the entire study period (NPV over 2000–2025) of US$155.518 billion, with the total economic system cost of delivered energy estimated at US$372.621 billion (NPV over 2000–2025). Reference Case Projected Emissions: For this analysis, the ENPEP-BALANCE model was configured to develop emission trajectories for 26 pollutants, including the major GHGs, pollutants of local/regional concern (PM, SO2, NOX, etc), as well as air toxics (e.g., heavy metals). The model projects total CO2 emissions to increase at an average rate of 5.8%/yr and reach 871 million t/yr by 2025 (see figure below). The industrial contribution changes the most noticeably, rising from 31% to 42%. This is driven by the high growth in industrial final energy as well as the continued reliance on solid and liquid fuels in this sector. Total national SO2 emissions reach their low point in 2003, with 1.83 million t/yr, but then more than double to 3.85 million t/yr (2025). The majority of the emissions growth can be attributed to an increase in industrial solid fuel and fuel oil combustion and an associated rise in SO2 emissions from 566 to 2,411 kt/yr over 2000–2025. By the end of the study period, industry is expected to be responsible for 63% of Turkey’s SO2 emissions. The increasing significance of the manufacturing sector goes hand in hand with a declining importance of the power sector. While in 2000, electricity generation accounted for 55% of national sulfur emissions, this share will be down to 24% by 2025. This reduction is projected in large part because coal generation stays more or less constant, while several new sulfur controls are already commissioned and expected to come on-line in the very near term. Turkey's Projected CO2 Emissions by Sector Through 2025 - Reference Case Conclusions – Reference Case: The Reference Case highlights the advantages of natural gas for the development of Turkey’s energy supply, especially in the power sector. Given the underlying price projections of the Reference Case, relying more extensively on gas use than levels used at present appears to be the least-cost way of meeting growing electricity demand. At the same time, emissions of most pollutants are moderated and grow at rates below the growth of final energy demand. The Constrained Gas Sub-critical Scenario attempts to quantify the benefits of natural gas against a greater use of coal and lignite by using conventional sub-critical generating technology. The results show that although gas imports and the import bill are higher under the Reference Case (by 23% and 1.5%, respectively), the economic cost of energy supply is lower and so are all emissions; hence, gas is a “win-win” option. The scenario also shows that any constraints on the gas supply Turkey encounters will impose substantial economic and environmental costs. In addition, the Constrained Gas Super-critical Scenario shows that if gas utilization is to be restricted, it is better to rely more heavily on super-critical technology rather than sub-critical. Results for a low-gross domestic product (GDP) variation of the Reference Case show the sensitivity of national emissions to the assumed economic growth. Under the low-GDP scenario, national CO2 emissions in 2025 are about 43% lower than under the Reference Case. The impact on other pollutants is comparable; that is, NOX emissions are 40% lower, PM emissions are 39% lower, and SO2 emissions are 32% lower. Conclusions – GHG Scenarios: Based on results from the GHG scenarios, the following conclusions can be drawn in relation to formulating a national policy on climate change. The table below as well as the following three figures show that demand-side management (DSM), cogeneration in industry, and improved technical efficiency in the power sector are clearly essential ingredients of future climate change policies. They are “win-win” options compared to the Reference Case. Under all these scenarios, the economic cost of energy supply and the cost of energy imports will be lower as well as emissions of CO2/GHG. In addition, there are substantial ancillary benefits involved in terms of PM, SO2, NOX, and other pollutants, particularly with regard to DSM and cogeneration. Summary Table of GHG Scenario Results Turkey's Projected CO2 Emissions Through 2025 - All Scenarios Turkey's Projected CO2 Emissions Through 2013 - All Scenarios Turkey's GHG Abatement Cost Curve However, it must be acknowledged that the scope for more reliance on cogeneration in industry and improved technical efficiency in the power sector is intrinsically restricted. Scenario results suggest that less than 5% and 1% reduction in CO2/GHG emissions, respectively, can be accomplished over the period 2000–2025. Also, the implementation costs for DSM may be underestimated while the environmental impact is the greatest in terms of projected emission reduction. The reduction in CO2/GHG emissions exceeds 10% over the period 2000–2025, and the potential may be even more than considered as the analysis only concentrated on the residential and industrial sector but excluded the transportation sector for lack of country-specific information. Greater natural gas utilization is clearly preferable to coal and lignite. The Constrained Gas Sub-critical and the Constrained Gas Super-critical Scenarios indicate CO2/GHG emissions more than 8% and 7% above the Reference Case, and the economic cost of energy supply is also higher, although the energy import bill is slightly lower. Nuclear power is not attractive for GHG reduction, even though the net energy import bill drops. It is expensive since the abatement cost of US$7.3 per ton CO2 exceeds the Global Environment Facility (GEF) guidelines and is at the top end of the range for the Prototype Carbon Fund (PCF). In addition, the scope is limited and the scenario results suggest that the abatement of CO2/GHG emissions would be less than 1% over the period 2000–2025. Although nuclear power would simultaneously cut emissions of other pollutants, there are serious environmental risks associated with nuclear development. Renewables have a role to play in GHG reduction policy, but development of renewables will need to be selective. Mini-hydro and windmills are the most promising and offer an attractive cost for the reduction of CO2/GHG at an estimated US$1.3 per undiscounted ton of CO2 and US$4.6 per ton of undiscounted carbon equivalent. Solar photovoltaic (PV) installations appear to be unattractive on cost grounds except perhaps for particular applications, such as off-grid supply or in low-temperature heating applications. The scope for mini-hydro and windmills is limited, and scenario results suggest that total abatement of CO2/GHG emissions would be less than 2% over the period 2000–2025. A carbon tax will bring about some beneficial inter-fuel substitution, inducing consumers to use less carbon-intensive gas in preference to coal and lignite. However, the result of these fuel shifts is an increase in the economic cost of energy supply. Also, at the tax rate considered (US$4/ton CO2), not much change occurs in the level of carbon emissions (less than a 1% drop over the planning horizon) so much higher tax rates are likely to be required to bring about substantial reductions. Each of the options applied individually does not have a major impact on CO2/GHG emissions: an effective national policy on climate change will have to rely on the aggressive application of a combination of options (e.g., DSM, cogeneration in industry, improved technical efficiency in the power sector, greater natural gas utilization, and investment in mini-hydro plants and windmills). Conclusions – Local Pollution Scenarios: Based on results from the Local Pollution Scenarios, the following conclusions can be drawn in relation to formulating national policies aimed at improving local air quality. As in the case of GHG reduction policies, any strategy to control local pollution should consider the following (see the table and the figure below): Summary Table of Local Pollution Scenario Results Turkey's Projected SO2 Emissions Through 2025 - All Scenarios Improving the petroleum product quality would cut sulfur emissions by more than 16% over the period 2000–2025 at a cost of US$252/tonne (discounted). The introduction of EU standards and the improvement of petroleum product quality would be cost-effective options to reduce emissions of sulfur. EU standards would result in sulfur emissions 36% lower than under the Reference Case over the period 2000–2025. The cost of abatement is estimated to be about US$231/tonne (discounted), and there would also be moderately lower emissions of PM and NOx. DSM, cogeneration in industry, and improved technical efficiency in the power sector can all contribute to local pollution control because the economic cost of energy supply and the cost of energy imports will be lower, as well as emissions of PM, SO2, NOx and ash. The use of natural gas is preferred over coal and lignite, because emissions of PM, SO2, NOx, and ash are all higher in the Constrained Gas Sub-critical and Super-critical Scenarios, as well as the economic cost of energy supply, although at a lower net energy import bill. The nuclear power scenario showed little impact on local pollutants and, in addition, the analysis makes no allowance for the potentially major environmental risks associated with the handling of nuclear fuel, the disposing of nuclear waste, and the potential for nuclear accidents. Although a carbon tax is normally regarded as an economic instrument for the control of GHG emissions, it would also yield useful reductions in local pollution as a by-product or ancillary benefit. In contrast with GHG reduction policies, windmills and mini-hydro showed little promise for local pollution reduction policy relative to the Reference Case, because they had a negligible or no impact on PM, ash, NOx and SO2. It should be noted, however, that the results are greatly influenced by comparison with the high preponderance of natural gas in the Reference Case. As is the case in the design of policies for GHG mitigation, it is clear that no one single policy option will have a major impact on all of the emissions causing local pollution. An effective national policy for the reduction of local pollution will have to rely on the application of a mix of options (e.g., DSM, cogeneration in industry, improved technical efficiency in the power sector, greater natural gas utilization, and tighter emissions standards). Model Transfer, Training, and Capacity Building: As part of the project, CEEESA transferred the model to Turkish institutions involved in the analysis and provided training to a number of Turkish experts. CEEESA has extensive expertise and experience in capacity building through the assistance we provide to our ENPEP-BALANCE users around the world in the form of training and implementation support. For more than 25 years, we have conducted training courses in many locations around the world and have successfully trained over 1,300 experts from more than 90 countries in the use of our tools. ENPEP-BALANCE is actively in use in many of these countries. ENPEP-BALANCE training courses and workshops can be tailored to your specific needs and can last anywhere from a few days to a couple of weeks. Courses may be held at Argonne's facility in the Chicago area or at your facilities. Click here for information on past and upcoming training courses or click on the pictures below.
Additional Resources: For more information on this application and the ENPEP-BALANCE model, download the following brochures, presentations, and papers in pdf format:
For more information, contact CEEESA |
 Background: Turkey's current carbon dioxide (CO2) emissions are estimated at 211 million metric tons (2000) and are expected to grow substantially over the next 25 years. Under a World Bank-sponsored Energy and Environmental Review (EER), the Center for Energy, Environmental, and Economic Systems Analysis (CEEESA) collaborated with several companies in Japan, Europe, and the United States to analyze a variety of pollution control and policy options that Turkish authorities might consider. A total of eight individual studies have been conducted under the EER to analyze key energy technology issues. The purpose of CEEESA's Energy Sector Modeling Task was to merge information obtained in the other EER tasks and provide Turkey’s policy makers with an integrated systems analysis of different options for addressing various energy and environmental concerns.
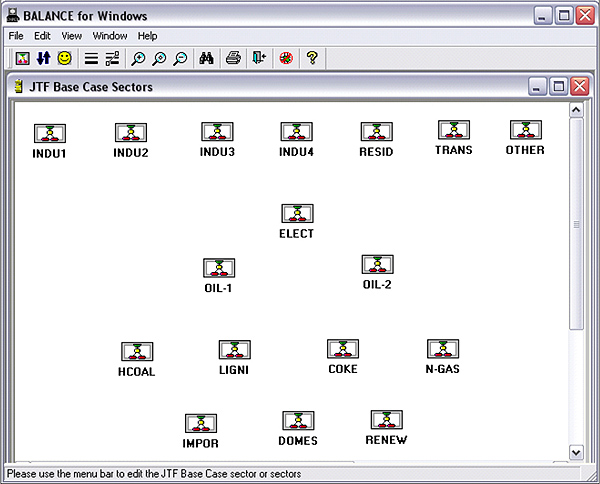


| U.S. Department of Energy Office of Science | UChicago Argonne LLC |
| Privacy & Security Notice | Contact Us | Search |