| Center for Energy, Environmental, and Economic Systems Analysis (CEEESA) |  |
Research Areas:
Energy, Environment, and
Economics
National and Homeland
Security
Infrastructure Assurance
Emergency Preparedness
Social Dynamics
Policy Analysis
Core Capabilities:
Systems Analysis
Modeling, Simulation, and
Visualization
Complex Adaptive Systems
Decision Support and Risk
Management
Information Sciences
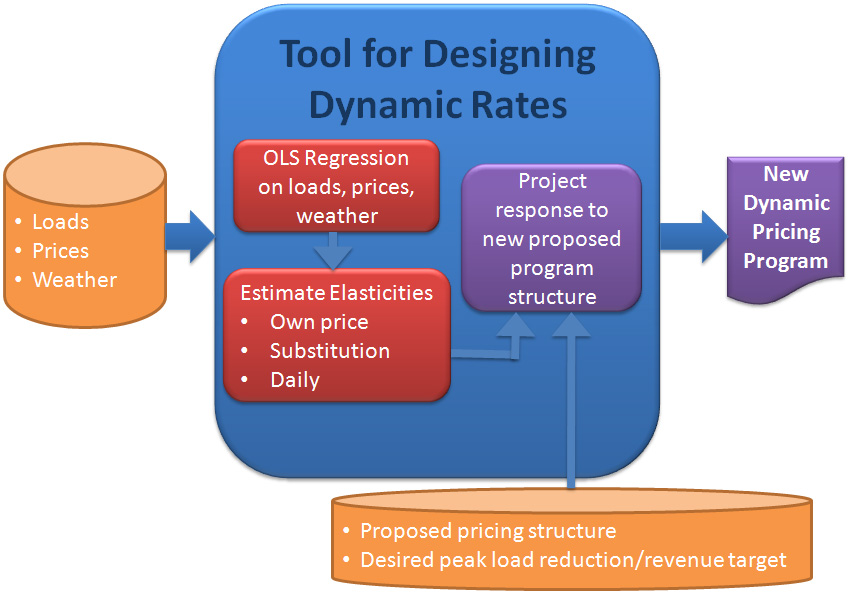
Tool for Designing Dynamic RatesThe tool to calculate price elasticity of electric demand and design future dynamic pricing programs is a Microsoft Excel based application that was funded by DOE Office of Electricity Delivery and Energy Reliability (OE) and developed by Argonne National Laboratories and Energy and Environmental Resources Group, LLC (E2RG). This tool is used to calculate elasticity of substitution and own-price elasticities of electric demand using the augmented Constant Elasticity of Substitution model. Using the calculated elasticity values, the tool can further project changes in electricity loads as a function of electricity prices and temperatures as specified by utilities; conversely, the tool is capable of calculating the pricing structure necessary to achieve utility-defined objectives for peak load reduction and revenue, under a given set of temperatures. Features:
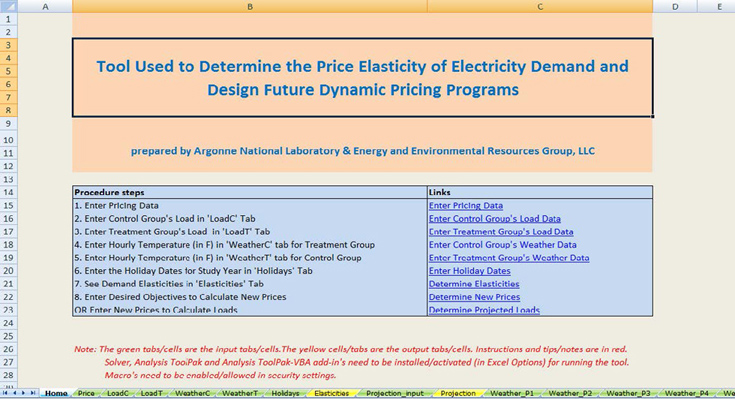
 Figure 2 provides a snapshot of the tool. 
For more information, contact CEEESA. |