| Center for Energy, Environmental, and Economic Systems Analysis (CEEESA) |
Research Areas:
Energy, Environment, and
Economics
National and Homeland
Security
Infrastructure Assurance
Emergency Preparedness
Social Dynamics
Policy Analysis
Core Capabilities:
Systems Analysis
Modeling, Simulation, and
Visualization
Complex Adaptive Systems
Decision Support and Risk
Management
Information Sciences
Assessing Current, Near-term, and Long-term U.S. Hydrogen MarketsIntroduction: This activity supports the Department of Energy's (DOE) Nuclear Hydrogen Initiative (NHI). DOE-NHI is conducting several system studies to gain a better understanding of nuclear power’s potential role in a hydrogen economy and what hydrogen production technologies show the most promise. This work couples with system studies sponsored by DOE-EERE and other agencies that provide a basis for evaluating and selecting future hydrogen production technologies. This assessment includes identifying commercial hydrogen applications and their requirements, comparing the characteristics of nuclear hydrogen systems to those market requirements, evaluating nuclear hydrogen configuration options within a given market, and identifying the key drivers and thresholds for market viability of nuclear hydrogen options. A variety of potential technologies and applications for nuclear hydrogen have been proposed. Yildiz et al, 2005 describe various nuclear hydrogen production technologies and discuss potential technology configuration implications of different hydrogen system applications. As part of that analysis, a market assessment was conducted to evaluate a number of different hydrogen markets. The purpose of this section is to present a broader context for nuclear hydrogen, survey existing and future hydrogen markets, such as liquid-fuel refining, industrial applications, oil and tar sand processing, mobile fuel cells applications, and others, and to identify key requirements that may affect the market uptake of nuclear hydrogen as well as particular nuclear technology choices. The hydrogen supply chain and the potential production of nuclear hydrogen cannot be analyzed in isolation. Rather, both need to be embedded in the overall energy system analysis to capture the feedbacks and interactions with other market segments (Figure 1). Given the complexities and dynamics involved in the emergence of a new hydrogen economy, and its relevance to the opportunities for nuclear hydrogen, an integrated systems analysis approach is needed to determine the role nuclear hydrogen might play in this environment (click here for agent-based modeling of H2 transition). The market characterization in this section will describe various factors and dynamics that may affect the potential role nuclear can play in supplying the hydrogen needs in the various segments (e.g., size of markets, market trends, competing sources, location issues, etc.). This should be understood, however, as just one piece of the puzzle and a necessary precursor to a full system study of nuclear hydrogen.
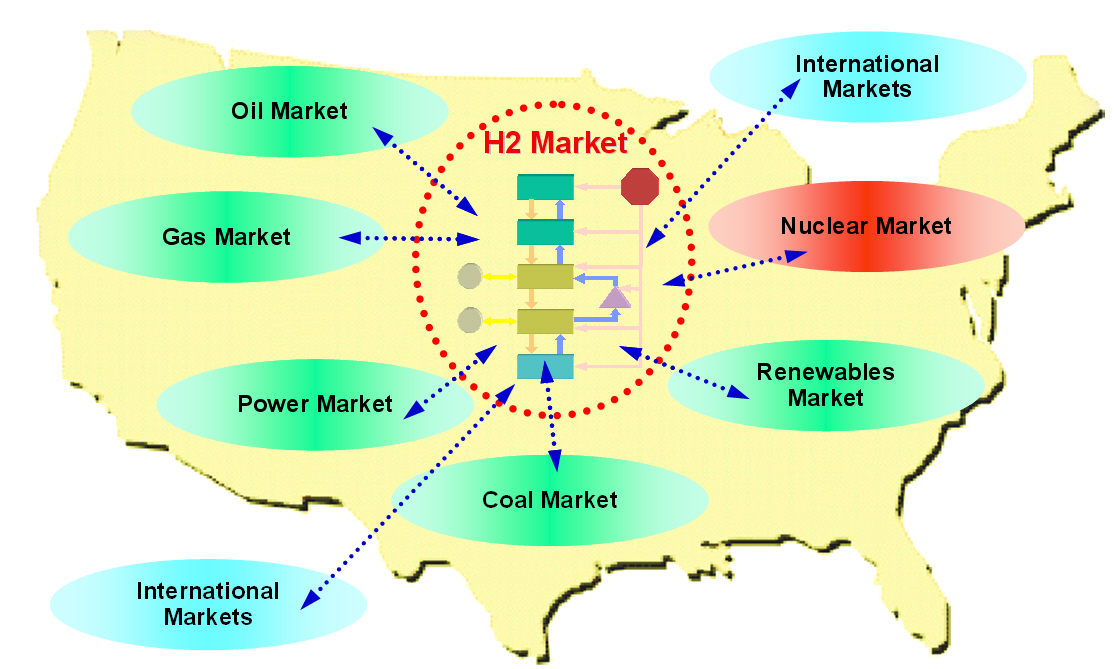
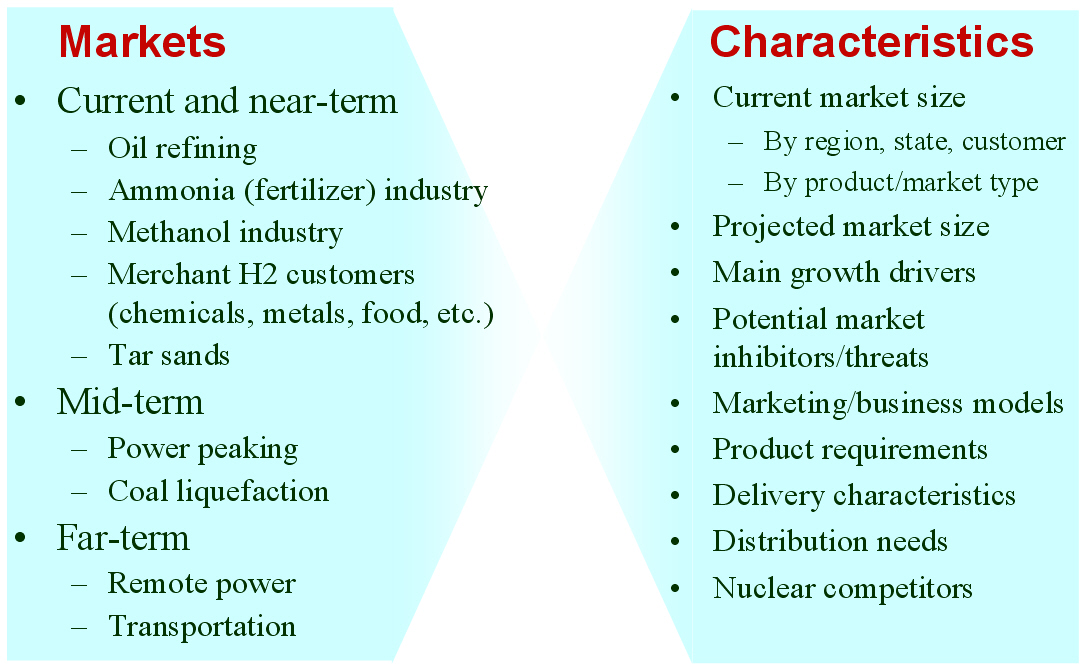
Figure 1: Nuclear and Hydrogen Markets as Part of the Overall Energy System The market adoption of a technology is driven by a number of factors, such as performance, costs, prices, and resulting profitability, as well as the competitive position of a certain technology vis-à-vis alternative suppliers. In addition, today’s volatile energy markets illustrate the importance of considering risk in deciding if and when to enter a particular market, as well as in deciding what choice of technology to pursue. Regional considerations are equally important. The market size for hydrogen will clearly vary substantially across the country, and this variation will change over time. If the transition is successful, the initial demand centers around large industrial facilities (e.g., petroleum refineries) will give way to a more geographically dispersed consumption pattern focused on larger metropolitan areas. Similarly, on the supply side, differences in regional resource and technology infrastructure availability across the country may favor one technology over another. This may be particularly significant for the early to mid stages of the transition when one might envision pockets of hydrogen production and consumption that are to some degree isolated given the technical and economic challenges of large-scale, long-distance transportation of hydrogen. In this type of situation, noticeable differences in the market price of hydrogen can be expected with a direct impact on the competitiveness of alternative hydrogen production technologies. This section provides an overview of different hydrogen markets. Markets are distinguished into current or near-term, mid-term, and long-term. Near-term markets are those that could be expected to grow over the next five years. Mid-term markets could develop over the next five to ten years, with far-term markets developing after that. Each of the end-use markets may have significantly different needs and characteristics. It is important to understand these differences as they will impact the outlook for particular production technologies and should be used in guiding future technology research and development. We use a variety of attributes to describe current and future hydrogen markets. Figure 2 lists a summary of the attributes we consider. Not all of the information is available for each of the markets. For existing markets, the description typically starts out with the current volume of the market with breakdowns by location and product type (e.g., liquid or gaseous), market type (e.g., captive or merchant), and recent and projected trends. We will try to identify some of the main drivers behind the growth in each market segment as well as any potential market inhibitors or threats. If available, the market description will discuss specific business models used in selling hydrogen and present specific product and delivery requirements. Similar information is provided for mid- and long-term markets.
Figure 2: Hydrogen Markets, Characteristics, and Attributes Some of the markets represent large-scale consumers with an already established and relatively centralized demand distribution (e.g., industry and refineries), whereas other markets such as transportation will slowly develop over time and potentially have much lower demand densities. This will directly affect the timing of the nuclear hydrogen potential. Large, current markets, often in the form of captive consumers, may present early opportunities for nuclear hydrogen if nuclear production can meet or exceed the benchmarks for technical and financial performance needed to compete with established technologies. Developing markets will present challenges and hurdles that nuclear will only be able to overcome as markets mature into more densely concentrated demand centers. This applies equally to current merchant-type hydrogen markets with their relatively small consumers mostly relying on distributed production and delivery. Overview of Current U.S. and Global Hydrogen Consumption: Worldwide hydrogen consumption is approximately 50 million tonnes per year [Shell, 2004a], including intentionally produced hydrogen as well as hydrogen that is produced as a by-product in the petrochemical industry and consumed on site. Table 1 shows how the 2003 global consumption of intentionally produced hydrogen of 41.09 million tonnes breaks down by sector and region. Worldwide, ammonia production accounts for 57% of total hydrogen demand, followed by oil refining (27%) and methanol (10%). The U.S. consumes about 19% of the total global hydrogen production. About 95% of the total demand is captive; that is, the hydrogen is produced at the site of consumption [AirProducts, 2004]. The remainder is produced as merchant hydrogen.
Table 2 describes the U.S. hydrogen markets discussed in more detail in the following sections. The table summarizes current market volumes (total and regional), typical consumer size, and size range of individual demand centers, and presents an overview of recent trends, outlook, and growth drivers and threats for each of the market segments. Table 2: Overview of U.S. Hydrogen Markets
b/d: barrels per day
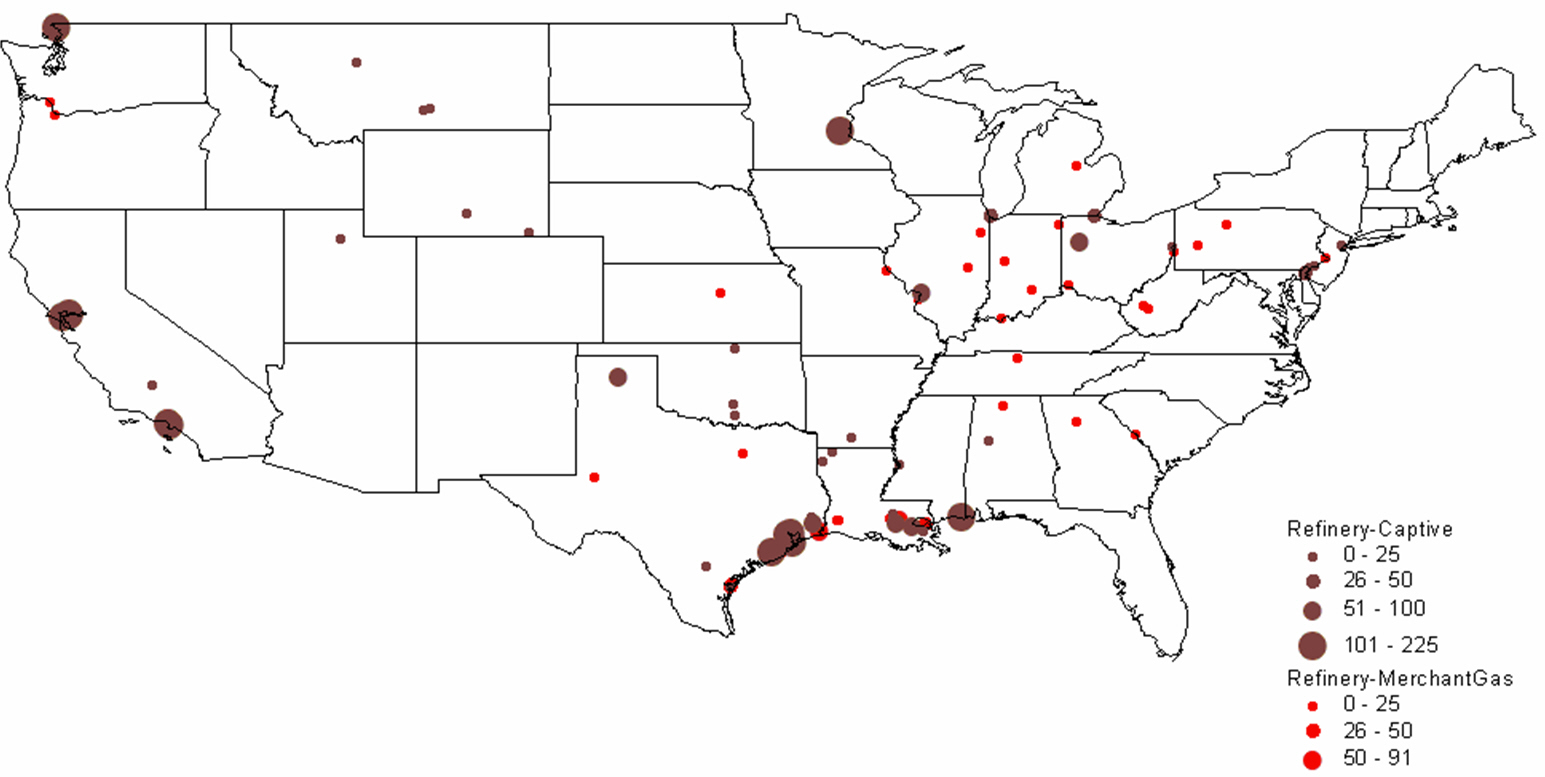
CURRENT U.S. HYDROGEN MARKETS Oil Refining: U.S. oil refineries consumed about 4.08 million tonnes of hydrogen in 2003. The refinery demand is driven by the need to produce cleaner transportation fuel to meet environmental regulations (e.g., low sulfur requirements) while the input slate continually shifts toward processing heavier crude oils. This upward trend is expected to continue and already accounts for a large part of the growth in hydrogen sales experienced by the major producers, such as AirProducts, Praxair, etc. Refineries have captive hydrogen demand; that is, the hydrogen is produced either on site or in facilities located nearby. But they also rely on merchant hydrogen to meet their needs. Of the 145 refineries, 62 have on-site, captive hydrogen production facilities totaling about 3.19 million tonnes per year. Figure 3 shows that the steam methane reformers used to meet captive hydrogen demand are located in 22 states with total state-wide consumption ranging from as low as 1,000 tonnes per year in West Virginia to about 1.11 million tons per year in California. Combined, Texas and California account for 64% of the total captive hydrogen production. On a regional basis, Petroleum Administration Defense Districts (PADDs) III and V account for 83% of the total demand. An additional 0.89 million tonnes of compressed merchant gas is consumed at a total of 67 refineries. Figure 4 gives the geographical distribution of consumption and also shows the extent of 2003 hydrogen consumption by location for both captive and merchant demand.
Figure 3: U.S. Oil Refining Captive H2 Consumption in 2003 by State
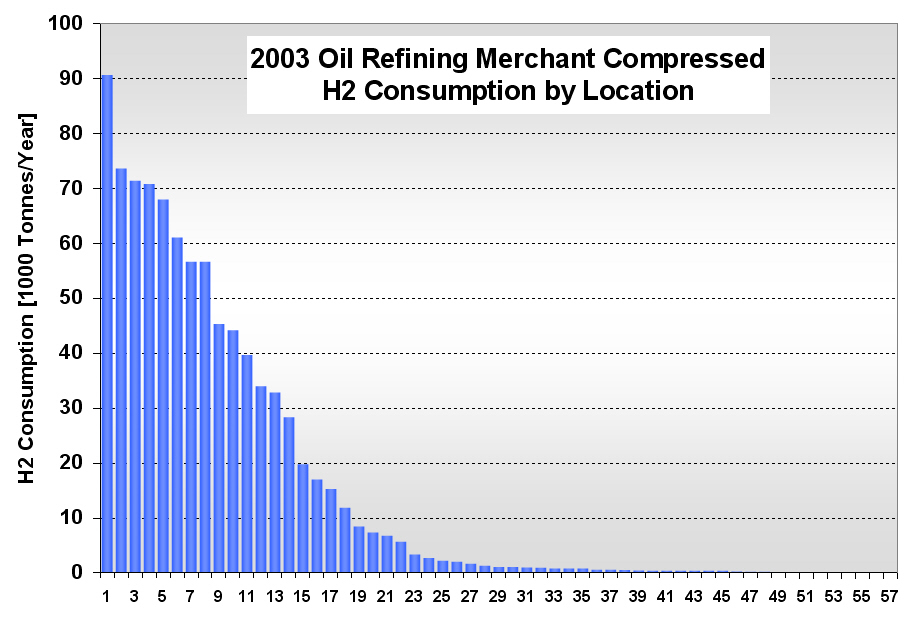
Figure 4: 2003 Hydrogen Consumption at U.S. Refineries By Location (1000 tonnes) Individual captive demand for the 62 facilities at 55 locations ranges from less than 1,000 tonnes to over 225,000 tonnes per year as shown in Figure 5, with the median size at about 25,500 tonnes per year. Of the 67 facilities at 57 locations that supply the compressed merchant hydrogen gas to oil refineries, the size variation is more noticeable. The median of those facilities is much lower, at about 1,090 tonnes per year, with the largest demand at 91,000 tonnes (Figure 6). Recent facilities by AirProducts and Praxair are in the range of 90,000 tonnes per year (or about 100 MMscfd). This is important to note as discussions on nuclear production facilities assume hydrogen outputs of around 60-70,000 tonnes per year for 600 MWth reactors [WSRC, 2004], which would indicate a reasonable fit in terms of facility sizing in the oil refining industry. There are about 20 captive locations in this size range or above and about 6 merchant facilities. Using a plant size similar to the proposed Secure Transportable Autonomous Reactor (STAR) design [Wade, et al., 2004] that is expected to produce about 37,000 tonnes per year [Doctor, et al., 2003], the number of current refining locations with an appropriate size would increase to 36.
Figure 5: U.S. Oil Refining Captive H2 Consumption in 2003 by Location
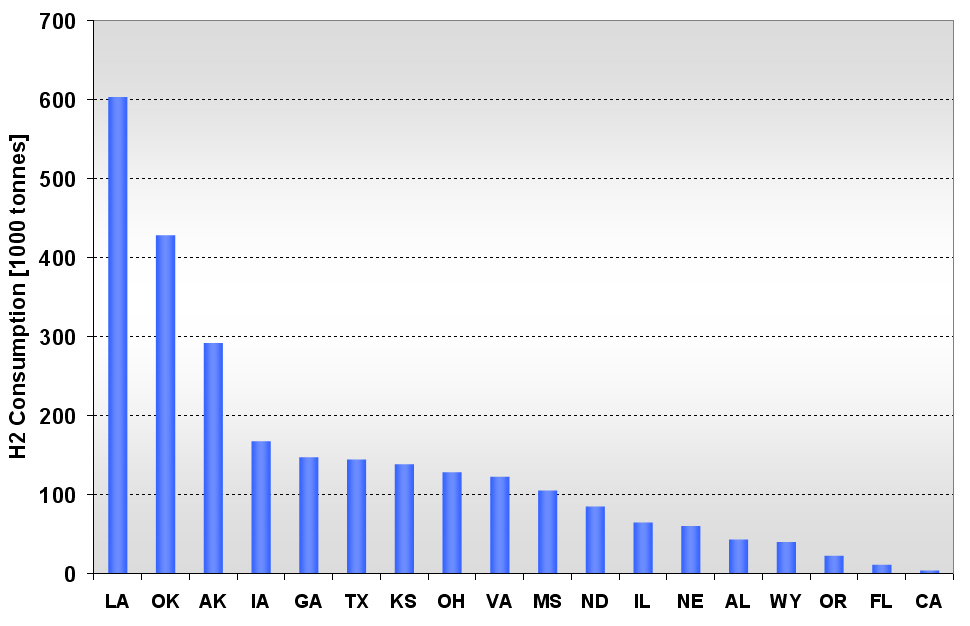
Figure 6: U.S. Oil Refining Merchant Compressed H2 Consumption in 2003 by Location Refinery merchant hydrogen facilities are often based on a build-own-operate (BOO) type business scheme with the demand mostly supplied through long-term supply contracts. This allows both the consumer and producer to manage their risk. On the production side, it provides stable revenue projections and easier access to financing. Construction times are short and hydrogen producers have streamlined the design process of their facilities to minimize the risk of costly construction delays. The annual hydrogen production profile is continuous and steady-state, even though gasoline production has seasonal variations. However, on-site refined product storage of up to several months provides a balancing mechanism and a means to stabilize monthly production levels. Product requirements in the industry call for moderate hydrogen purity in this market segment. Hydrogen demand in the oil industry is projected to grow fairly rapidly in the medium term. Expected annual growth rates range from 4% [IG, 2005] to about 5.5% [BCC, 2003]. The merchant part of the market is projected to grow at more than those rates; that is, at about 8% per year [BCC, 2003] and up to 10-15% out to 2008 [SRI, 2004]. Ammonia Industry: Ammonia is an intermediate product used in the manufacturing of a variety of nitrogen fertilizer materials and industrial products. Fertilizer, by far, is the largest end-use market of ammonia, with up to 90% of the annual NH3 production going toward that purpose. Most of the global ammonia is produced by catalytically reacting hydrogen coming from natural gas reforming with atmospheric nitrogen under elevated temperature and pressure. World ammonia production in 2003 was 132.1 million tonnes NH3 and consumed about 11.7 million tonnes of H2. U.S. production of ammonia in 2003 was about 8.8 million tonnes, consuming about 2.62 million tonnes of hydrogen. Less than 1% of this (24.1 kt) was merchant compressed gas; the rest of it was captive demand. Hydrogen consumption in this market is relatively concentrated. Figures 7 and 8 show that there are currently 31 ammonia production facilities in 24 locations in 18 states consuming H2. The top three states, Louisiana, Oklahoma, and Alaska, account for 51% of the total H2 consumption, or 1.33 million tonnes. Several locations have multiple ammonia production facilities, including Donaldsonville, LA (5 facilities), Kenai, AK (2 facilities), Verdigris, OK (2 facilities), and Dumas, TX (2 facilities). As a result, three cities account for 43% of the total demand:
Figure 7: U.S. Ammonia H2 Consumption in 2003 by State
Figure 8: U.S. Ammonia H2 Consumption in 2003 by Location Facilities are fairly large sized in terms of H2 demand. At half of the 24 locations, consumption exceeds 109,000 tonnes per year and 16 locations have an annual H2 demand of over 60,000 tonnes. The size in H2 consumption by location ranges from 4,000 to 604,000 tonnes (due to multiple facilities at one location). Figure 9 shows the location and hydrogen consumption of the various ammonia production locations.
U.S. demand for ammonia has remained relatively constant over the last 15 years (15.1 million tonnes in 1990 and 14.9 million tonnes in 2002). Consumption dropped about 10% in 2003 to 13.8 million tonnes and is projected to stay at that level until 2008 [SRI, 2004]. While consumption is relatively stable, domestic production, and along with it, associated hydrogen consumption, has declined noticeably over the last few years. This drop in domestic production and the accompanying shift to imported NH3 is primarily due to the recent run-up in domestic natural gas prices. The ammonia industry is very sensitive to natural gas price fluctuations, as gas may account for up to 70-90% of ammonia production costs. As a result, ammonia-related hydrogen consumption has dropped almost 10% between 1999 and 2003 from 2.9 to 2.62 million tonnes H2. The shift toward more ammonia imports is expected to stabilize. Domestic NH3 production in 2008 is projected to be about the same as in 2003, that is, about 8.8 million tonnes. Similarly, it is expected that in the medium term, hydrogen consumption of the sector will remain at 2003 levels. Given its cost structure, the U.S. ammonia industry will continue to be sensitive to domestic natural gas price volatility. This exposure to price volatility will remain even if the current rush toward liquefied natural gas (LNG) will eventually lead to a global natural gas market with converging natural gas prices that would reduce current production cost advantages of off-shore ammonia producers. A shift to a technology with less feedstock price volatility may be attractive to the U.S. ammonia industry from a risk mitigation perspective. Also, with its concentrated demand and continuous hydrogen production profile (as the finished product is stored for several months to accommodate fluctuating fertilizer demand), the ammonia industry lends itself to large hydrogen production facilities. Methanol Industry: The global methanol industry operated about 100 facilities worldwide [SenterNovem, 2002], manufactured 30.1 million tonnes of product in 2001, and consumed approximately 5.65 million tonnes of hydrogen coming largely from natural gas reforming. Methanol is primarily an intermediate product used in the manufacturing of a variety of materials. Worldwide, the largest end-use for methanol is the production of formaldehyde (35%), which finds extensive use in the construction industry, followed by methyl tertiary-butyl ether or MTBE (25%) used as an oxygenate in reformulated gasoline, acetic acid (9%), and a variety of other products. U.S. methanol consumption in 2001 totaled about 8.52 million tonnes. The production capacity in that year was 5.79 million tonnes, but actual production was only 3.25 million tonnes. Almost two-thirds of domestic methanol consumption was imported (5.43 million tonnes), as the industry, in reaction to rising natural gas prices [1], idled or shut a number of production facilities. About 1.57 million tonnes of capacity was put on standby and 1.37 million tonnes permanently closed between early 1999 and beginning 2001 [IG, 2002]. This trend continued for the next two years. As a result, the sector’s hydrogen consumption has significantly declined:
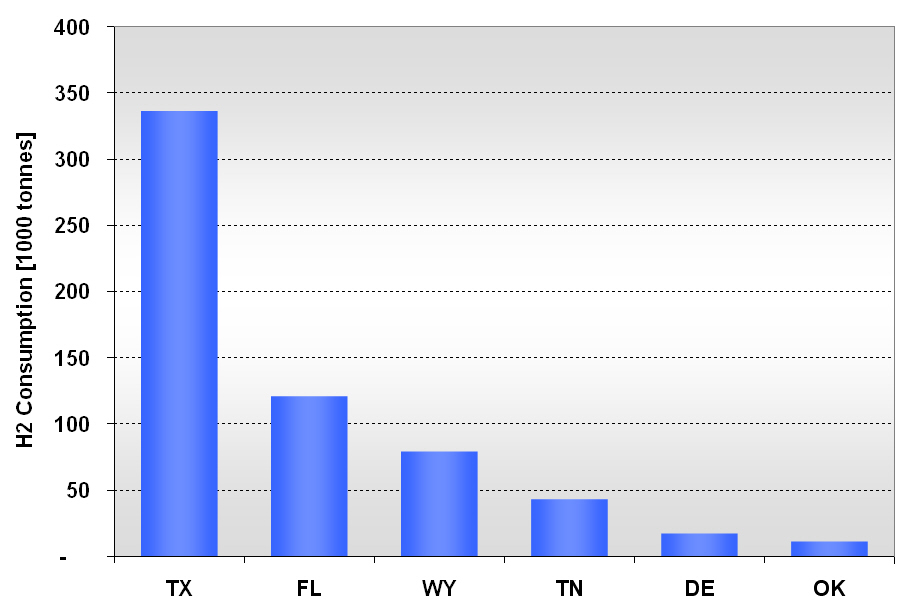
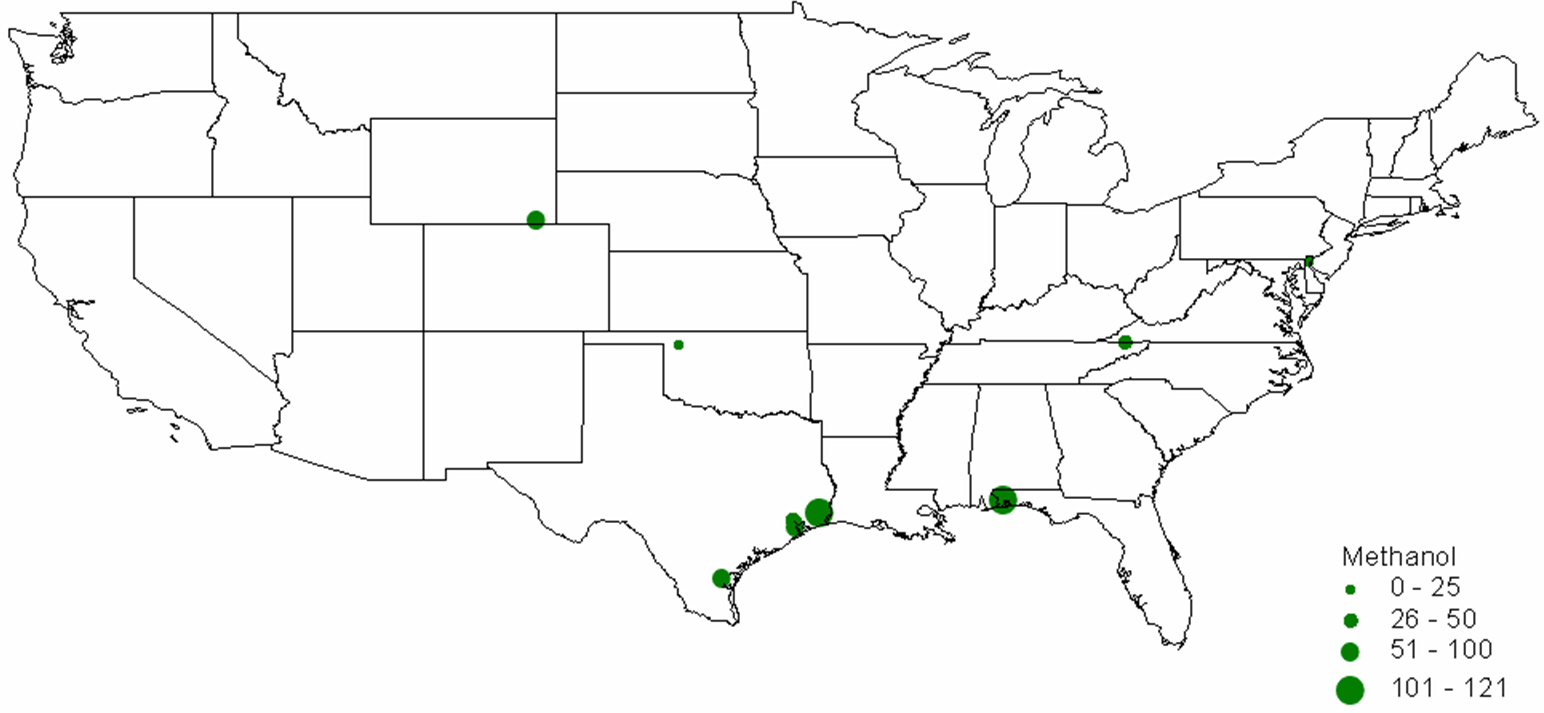
In 2001, there were 10 methanol production facilities operating in the U.S. with hydrogen consumption ranging from 11,000 to 121,000 tonnes (Figure 10). Half of the plants consumed 79,000 tonnes or more. Texas alone accounted for 55% (336,000 tonnes) of the methanol-related hydrogen consumption, followed by Florida with 20% (121,000 tonnes) as shown in Figure 11. Figure 12 shows the location and hydrogen consumption of the various methanol production locations.
Figure 10: U.S. Methanol H2 Consumption in 2001 by Location
Figure 11: U.S. Methanol H2 Consumption in 2001 by State
Figure 12: 2001 Hydrogen Consumption for Methanol (1000 tonnes) The largest end-use for methanol in 2001 in the United States was MTBE, accounting for 37% of total demand, with formaldehyde coming in at second with 23%. Current legislative actions on the state (e.g., California and 19 other states) and federal level may either severely limit, or ban altogether, the use of MTBE in reformulated gasoline, with ethanol being the alternative choice. While other methanol end-uses are expected to grow in the mid term, the MTBE phase-out is projected to lead to an overall decline in U.S. methanol consumption to around 8.10-8.31 million tonnes by 2005 with an estimated drop in hydrogen consumption to about 380-384 kt. New potential growth areas for methanol include methanol fuel cells, methanol for stationary power generation, methanol for portable power generation, methanol wastewater denitrification (already 200 treatment plants in the U.S. use methanol and more states are adopting regulations promoting denitrification), and methanol in biodiesel (12-15% of biodiesel is methanol by volume). The second and third largest end-uses of methanol, formaldehyde and acetic acid, are used as adhesives and bonding agents in construction materials, and as such are dependent on growth in the construction industry. Total 2003 U.S. Hydrogen Consumption by Market and Location: Figure 13 shows the 2003 hydrogen consumption by state for the three current major U.S. hydrogen markets (oil refining, ammonia, and methanol). The top five major regional markets include Texas (25%), California (18%), Louisiana (14%), Oklahoma (7%), and Mississippi (5%). These regions might provide more favorable conditions for larger, centralized hydrogen production technologies. Figure 14 shows a mapping of these markets by location.
Figure 13: U.S. Hydrogen Consumption in 2003 by State
Figure 14: Location and Hydrogen Consumption for Oil Refining and the Production of Ammonia and Methanol (1000 tonnes)
NEAR-TERM U.S. HYDROGEN MARKETS Oil and Tar Sands Production: The two largest deposits of oil sands are located in Canada (Figure 15) and Venezuela. In Canada, the bulk of the deposits are found in four regions in Alberta, including Athabasca, Wabasha, Cold Lake, and Peace River (Figure 15). Canada’s proven oil sand reserves total about 179 billion barrels, second only to Saudi Arabia’s petroleum reserves of 259 billion barrels [Manor, 2005]. Oil sand production in 2003 reached 964,000 b/d with 64% coming from surface mining, 23% from in-situ thermal extraction, and the remainder from other techniques. Oil sand production in 2003 was substantially above Canada’s 629,000 b/d of conventional oil production. Over the last 10 years, oil companies have heavily invested in Canada’s oil sand resources (US$24 billion between 1996 and 2002) and are making major commitments in the near-to-mid term with investment announcements totaling over US$70 billion until 2020 [EUB, 2004].
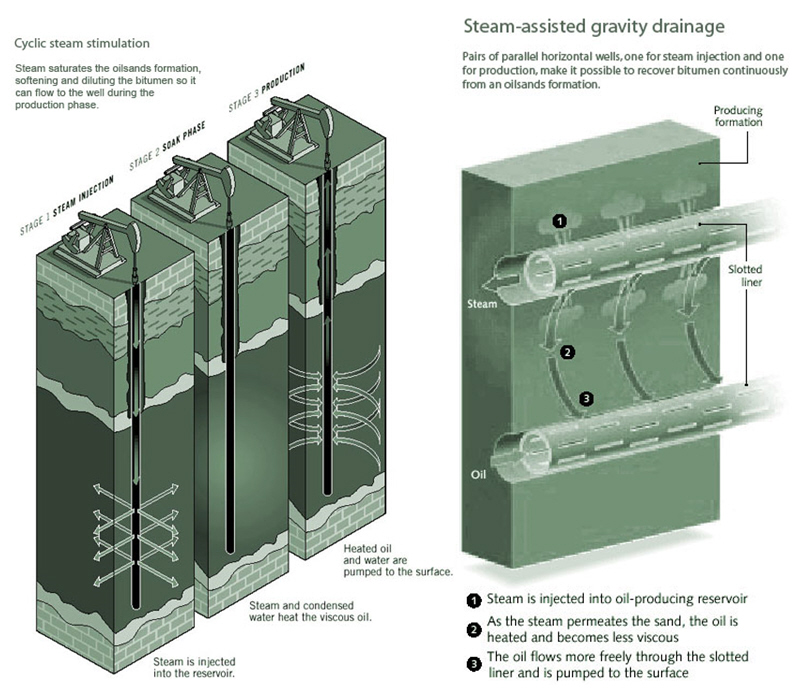
Figure 15: Location of Canadian Oil Sand Deposits [EUB, 2004] Oil or tar sand deposits consist of bitumen (10-12%), mineral matter such as sand and clay (80-85%), and water (4-6%). Bitumen is a heavy, black, molasses-like, viscous oil that must be treated before it can be further processed. Whereas in conventional crude oil extraction the product flows either naturally out of the ground or is pumped out, oil sand recovery is different and depends on the depth of the deposits:
Figure 16: In-situ Oil Sand Recovery [CEC, 2005] Current in-situ techniques rely mostly on natural-gas-fired steam boilers to provide the steam needs. The process is very water and energy intensive, requires a large amount of hydrogen for upgrading the bitumen, and typically recovers between 25% to over 60% of the bitumen in the sand deposits. Oil sand production is forecast to grow substantially to as much as 3 million b/d by 2020 as shown in Table 3. Table 3: Projected Oil Production from Canada’s Oil Sands (1000 barrels)
Using the data in Table 3 as well as values provided by the Alberta Chamber of Resources (2004) on specific natural gas consumption factors per barrel of oil produced from oil sands, the total gas consumption and hydrogen requirements can be estimated over this time period. The estimated annual hydrogen demands are as follows:
The projected hydrogen consumption in 2020 would be the same as the current captive hydrogen consumption in the entire U.S. refining sector. Surface mining operations typically range from 13,000 to 274,000 b/d with the median around 50,000 b/d [Alberta Department of Energy, 2004]. This means that half of the oil sand production facilities may have hydrogen requirements of around 46,000 tonnes/yr, which could be easily supplied by a medium-sized centralized hydrogen production facility. The oil sand projections presented in Table 3 would lead to a significant increase in natural gas consumption. According to Natural Resources Canada (2004), oil sand production consumed about 220 Bcf of natural gas in 2003. Table 4 shows projections for natural gas consumption in the oil sand industry. By 2020, Canada is projected to use almost 1,100 Bcf of natural gas in the production of synthetic crude oil from oil sands. For perspective, this is equivalent to 35% of Canada’s total 2003 gas demand. The share of H2-related gas consumption increases over time as the share of surface mining oil sands increases as projected by CAPP (2004). The increase in gas demand is of concern, and the Alberta Chamber of Commerce (2004) has started looking into alternative technologies to provide the steam and hydrogen, including coal gasification and nuclear power. Regarding nuclear options, the report concluded that for a 150,000 barrel per day in-situ facility, advanced nuclear reactor technology appears to be competitive at a natural gas price of $4 per Giga-Joule. However, at a 150,000 bpd facility, steam needs to be distributed over a larger area, possibly rendering a single-source steam configuration uneconomic. Table 4: Projected Natural Gas Consumption for Canada’s Oil Sands Production by Type of Extraction Method (Bcf)
MID- AND LONG-TERM U.S. HYDROGEN MARKETS Coal Liquefaction: The U.S. has substantial coal reserves (Figure 17) that are currently estimated at 244 billion tonnes [NMA, 2004] that could be increasingly used as a liquid transportation fuel source to supplement dwindling and ever more expensive supplies of conventional oil. There are two basic processes for liquefying coal: indirect and direct liquefaction. Using direct liquefaction, coal is partially dissolved at high pressure and temperature in a liquid solvent. As coal is hydrogen-deficient, converting solid coal into a liquid form requires the addition of hydrogen. Hydrogen is added under pressure to the coal and solvent mixture at temperatures up to 450°C. Using a catalyst brings down process temperatures and pressures. Producing 100 kg of synthetic crude oil through direct hydrogenation from 110 kg of coal requires 7.4 kg of hydrogen [Williams, 2003]. This synthetic crude requires further refining to take the hydrogen-to-carbon ratio from 1.6 to approximately 2.0 for finished liquid fuel products.
Figure 17: Location of U.S. Coal Reserves [EIA, 1997] Indirect liquefaction is a two-stage process. In the first stage, coal is heated in the presence of steam and oxygen to produce a mixture of carbon monoxide and hydrogen, or synthesis gas. Because of the low hydrogen content of coal, an additional source of hydrogen is required. This is usually supplied through the water-gas-shift reaction of carbon monoxide and water, with the resultant carbon dioxide being removed from the product stream. Nuclear hydrogen would represent a CO2-free alternative. In the second stage, the synthesis gas contacts a catalyst and is converted to a synthetic liquid fuel. Alternatively, utilizing a different catalyst and reactor setup, the synthesis gas can be converted to alcohols, such as methanol or ethanol. The conventional indirect liquefaction is based on the Fischer-Tropsch process. The process was invented in 1923 and was used in Germany to produce close to 700,000 tonnes of petroleum products per year by 1941 for a total production of about 4 million tonnes. For full-scale commercial deployment, however, substantial work is still needed to improve both process stages. The first process stage requires the use of an oxygen plant for making the synthesis gas. About 30-50% of the total investment requirements of a coal liquefaction plant are associated with the oxygen plant. This typically limits Fischer-Tropsch plants to very large operations, in the order of 100,000 b/d or more. Improved catalysts would make the process more economic. The combined production of hydrogen and oxygen, both needed for coal liquefaction through gasification, make nuclear technologies a potential candidate for this market. Based on the specific hydrogen requirements referenced above, we estimate the hydrogen requirements for a coal indirect-liquefaction plant with an output of 100,000 barrels of synthetic crude oil per day to be around 370,000 tonnes per year. This means that if the U.S. were to replace all its current net crude oil imports of 9.65 million b/d with synthetic crude produced from coal liquefaction it would require about 97 such facilities consuming about 37.7 million tonnes of hydrogen. That quantity is equivalent to about four-and-a-half times the current U.S. hydrogen consumption. Simultaneously, the coal indirect-liquefaction plant would consume much of the oxygen byproduct of hydrogen production. Oil Shale Production: Total global shale oil resources have been estimated to be around 2.6 trillion barrels, 2 trillion of which are located in the United States. The economically most attractive resources in the U.S. are found in Colorado, Utah, and Wyoming (Figure 18). These resources compare well in terms of richness, that is, liquid hydrocarbon yield per tonne of oil shale. More than 700 billion barrels of oil shale resources are found in concentrations that exceed the oil sands currently processed in Canada. Oil shale also compares highly favorably on another scale, that is, resource density. For example, Colorado oil shale can exceed 1 million barrels per acre, as compared to about 100,000 barrels/acre for Alberta’s oil sands and about 65 barrels per acre for Alaskan north slope oil.
Figure 18: Location of U.S. Shale Oil Resources [Bunger et al., 2004] Unlike the bitumen derived from oil sands, the organic compounds in oil shale are solid and do not melt and are not soluble. To convert oil shale into liquids, the hydrocarbons must be converted from a solid to a liquid state. There are two conventional approaches to do this. In one, the shale is fractured in-situ and heated to obtain gases and liquids at wells. The second is by mining, transporting, and heating the shale to about 450°C, adding hydrogen to the resulting product, and disposing of and stabilizing the waste. Full commercial-scale oil shale processing plants will likely be in the 150-200,000 b/d range. A significant barrier to developing this resource, though, is a concern about waste streams and environmental damage from shale oil development. Hydrogen for Transportation Needs: Hydrogen use in transportation might eventually be the main application for hydrogen production from nuclear energy. The full development of the use of hydrogen in transportation with the associated infrastructure is expected to take several decades, as different technological advancements in fuel cell design and storage and transportation of hydrogen will be needed. This application may involve both centralized centers of hydrogen production that use a number of nuclear plants or regional single-plant sites for local consumption. Owing to the inherent transition problems away from an established petroleum-based infrastructure, most analysts expect this transition to occur incrementally, with an initial focus on small-scale distributed hydrogen production (mostly natural gas based) to avoid the need for a new large-scale distribution infrastructure. Current hydrogen production facilities that are often near major population centers, such as oil refineries (as well as ammonia and methanol plants), as documented in the previous sections, could serve to jump-start this transition, such as the envisioned “mini-network and lighthouse concept” proposed by Shell [Shell, 2004]. Hydrogen production in those facilities could be increased incrementally to serve a small, but growing, transportation hydrogen demand. Once demand reaches a critical level in larger metropolitan areas, more centralized production technologies might take a hold in the market. Because of the long-term nature of this market development, hydrogen demand scenarios for transportation are highly speculative. Nevertheless, using the underlying hydrogen demand scenario used in the report on the hydrogen economy by the National Academy of Sciences [NAS, 2004], one can estimate the growing hydrogen demand (Table 5). The report bases its market forecast on an S-curve penetration rate. S-curves have been used for decades to forecast prospective market shares based on the introduction of new technologies aimed at large consumer markets. When applied to measuring market growth potential, an S-curve assumes that (1) the time required to gain a 10% market share is approximately the same as that required to move from a 10% to a 90% penetration rate and (2) the shift from a concave to convex curve represents a diminishing growth rate in a rising, competitive mass consumer market. Many analysts, therefore, contend that the issue in this market is not full-scale development into a mature market, but rather, that the difficulties lie in how to reach the threshold of 10% penetration. Table 5: Hydrogen Demand Scenario for Transportation
Peak Electricity: The peak electricity generation market is concerned with making use of variation of electricity demand daily, weekly, and seasonally. As a result of demand variation, the market price of electricity differs by an order of magnitude as a function of time. To meet peak demands, the utilities buy lower-capital-cost peaking power units, typically gas turbines that burn natural gas. In addition, utilities have developed storage devices so that they can buy electricity during times of low demand and low cost and sell the electricity from the storage devices during times of high demand and high prices. The volatility of the price of electricity could create a hydrogen market aimed at producing electrical power at those times of day when the price of electricity is at its maximum. Thus, plants that are able to produce hydrogen (and optionally oxygen) to produce more electricity at times of high demand are likely to maximize the profitability of the facility. Nuclear plants equipped with hydrogen production, hydrogen storage, and hydrogen-to-electricity conversion technologies could accomplish this objective. More information on these markets and a qualitative system configuration for a peak electricity nuclear system (PENS) can be found in Appendix A of the full report. Other Hydrogen Markets: Other potential long-term markets for nuclear hydrogen include the production of carbon-dioxide-neutral liquid fuels through direct atmospheric fuel production, biomass conversion, or the production of a chemical hydrogen carrier for use in transportation; hydrogen for air transportation; and hydrogen for direct reduction of iron ore. Using external energy in the form of electricity and hydrogen, liquid fuels can be manufactured from water and carbon dioxide that may either come from the atmosphere or the oceans. A variety of indirect fuel processes could be available to convert the carbon dioxide and hydrogen into liquid fuels. When using biomass to produce liquid fuels, such as ethanol, roughly one-third of the carbon in the biomass is emitted to the atmosphere in form of CO2, whereas only one-third ends up in the fuel itself. Using hydrogen from nuclear technologies, the CO2 from the bio-fuel factory could be collected and converted into additional fuel liquids. One alternative for avoiding a large-scale compressed gas or liquid hydrogen distribution infrastructure could involve the use of a chemical hydrogen carrier, such as metal amines, or some type of calcium oxide bed. Several studies have been conducted on using liquid hydrogen for a variety of different aircraft, including commercial jets. The direct reduction iron process typically relies on the use of natural gas for its syngas needs, but could be replaced by nuclear hydrogen. Additional Resources:
For information on using agent-based modeling and simulation for transition analysis, click here. [1] Natural gas may account for up to 55-65% of methanol production costs. For more information, contact contact CEEESA |
||||||||||||||||||||||||||||||||||||||||||||||||||||||||||||||||||||||||||||||||||||||||||||||||||||||||||||||||||||||||||||||||||||||||||||||||||||||||||||||||||||||||||||


| U.S. Department of Energy Office of Science | UChicago Argonne LLC |
| Privacy & Security Notice | Contact Us | Search |