| Center for Energy, Environmental, and Economic Systems Analysis (CEEESA) |
Research Areas:
Energy, Environment, and
Economics
National and Homeland
Security
Infrastructure Assurance
Emergency Preparedness
Social Dynamics
Policy Analysis
Core Capabilities:
Systems Analysis
Modeling, Simulation, and
Visualization
Complex Adaptive Systems
Decision Support and Risk
Management
Information Sciences
Impact of Plug-in Hybrid Electric Vehicles on the Electricity Market in IllinoisBackground: The transportation sector is the largest carbon-emitting source in the U.S. economy. The U.S. fleet of light- and heavy-duty vehicles is also a major contributor to emissions of carbon monoxide, hydrocarbons, nitrogen oxides, and particulate matter, as well as local ozone issues. In addition, the transportation sector is the driving force behind the U.S. need for petroleum imports. With oil prices currently at record highs, a significant share of U.S. research and technology development is dedicated to reducing the petroleum dependence of the sector and the nation, as well as reducing transportation-related pollution. These challenges are being addressed on a number of fronts, including improvements in fuel efficiency, as well as development of vehicles that use fuel other than petroleum, that is, alternative fuel vehicles (AFVs). Given recent advances in lithium-ion batteries, one of the alternative vehicle technologies presently receiving much attention is plug-in hybrid electric vehicles (PHEVs). PHEVs could potentially play an important role in the future U.S. transportation system. A large-scale introduction of PHEVs would also have a substantial impact on power systems and electricity markets. In this preliminary study, we ran a set of simulations using our Electricity Market Complex Adaptive System (EMCAS) model to analyze the potential impact of PHEVs on the electricity market and the transmission system in Illinois. Load Analysis: We forecasted the additional load from PHEVs in Illinois under several different assumptions about PHEV penetration and charging patterns. Here, we focus on the results from the two scenarios described in Table 1. In scenario A, we assume that 12.5% of the light-duty vehicles (LDVs) in the state are PHEVs and that all of these vehicles are charged at night. Scenario D assumes that 25% of LDVs are PHEVs and that some charging takes place during the day as well. Table 1: PHEV scenarios
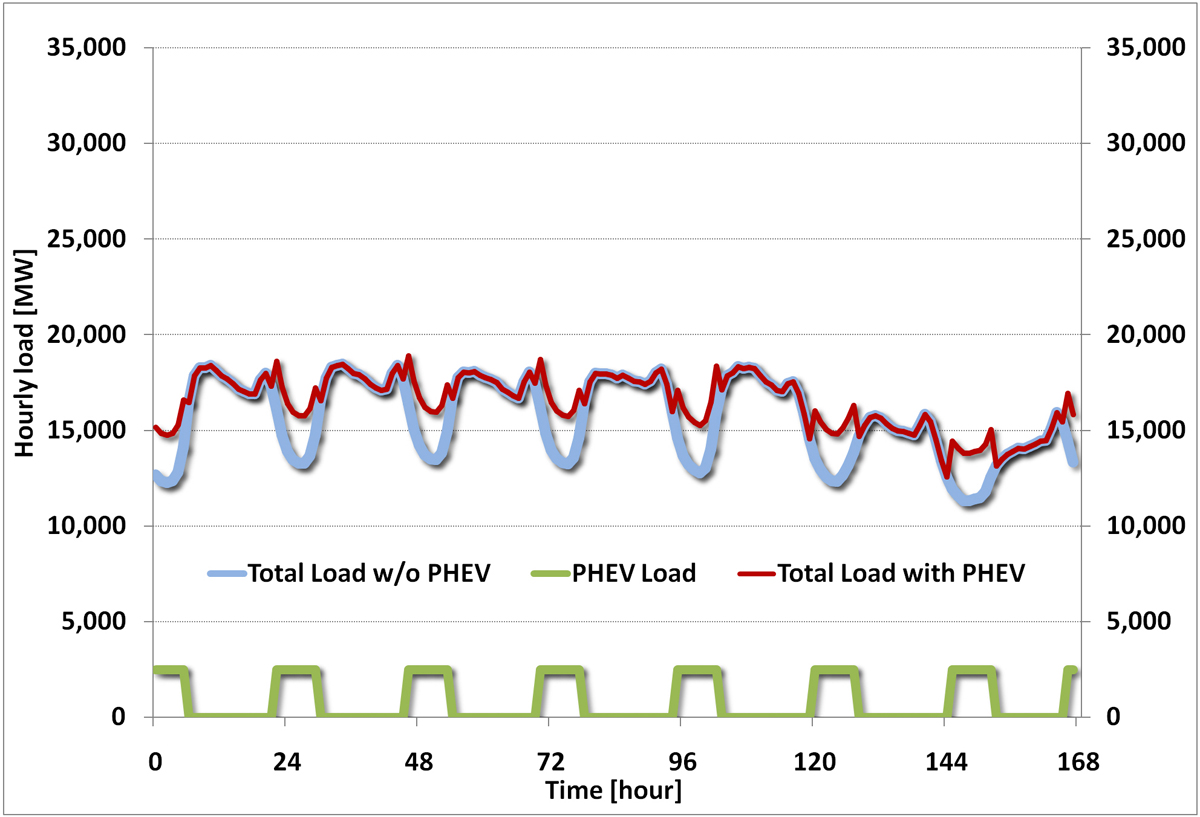
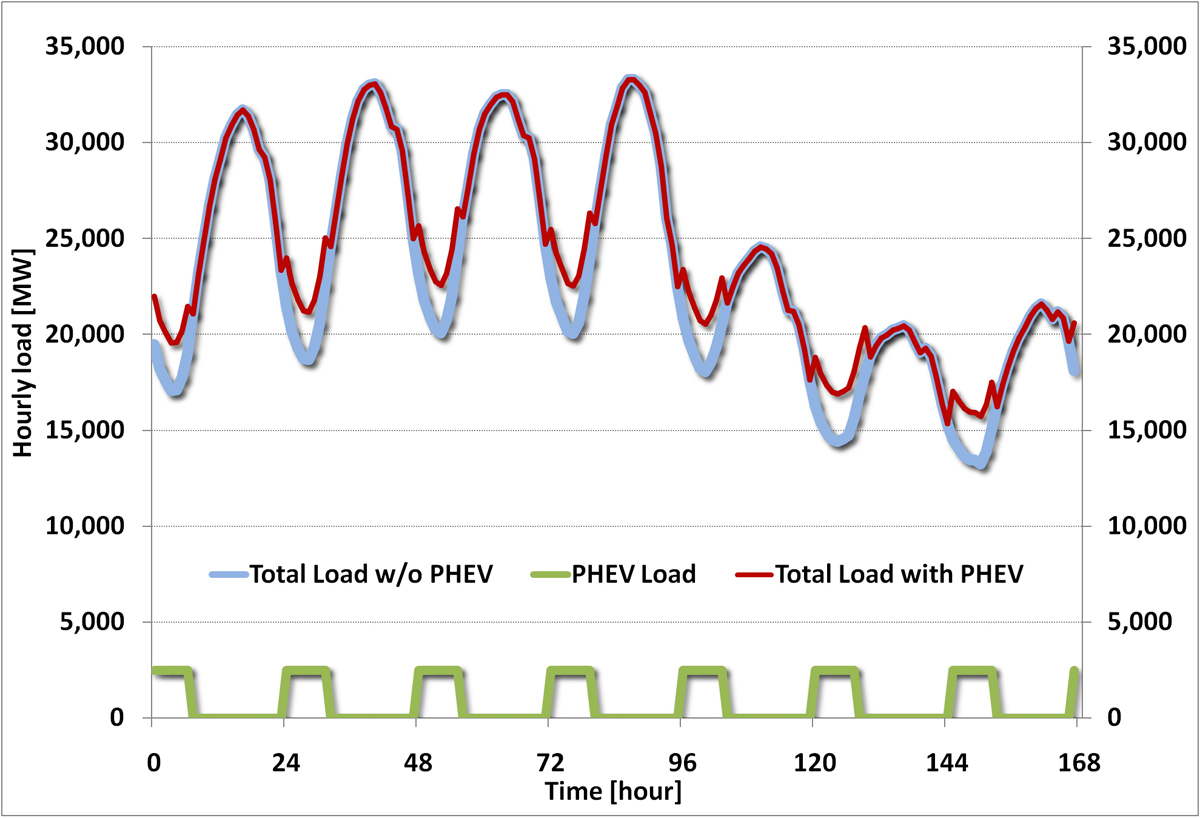
The additional load from PHEVs was added to an hourly load forecast for Illinois for 2007. Figures 1 and 2 show how the total electricity load would change as a result of additional PHEV load in scenario A for two selected weeks. Week 14 is in the spring, when there is a low demand for electricity. In this week, the additional PHEV load almost levels out the typical day/night pattern in the original load data. Week 32 represents a summer week with peak loads, and the impact of the PHEV load is therefore less noticeable because the total load still has distinct troughs at night. The impact on hourly loads is, of course, more significant in scenario D with twice as much PHEV charging. Scenario D also gives higher loads during daytime, resulting in increased peak loads in the system.
Figure 1: Impact of PHEVs on hourly electricity loads in Illinois, week 14, scenario A (click image for larger version)
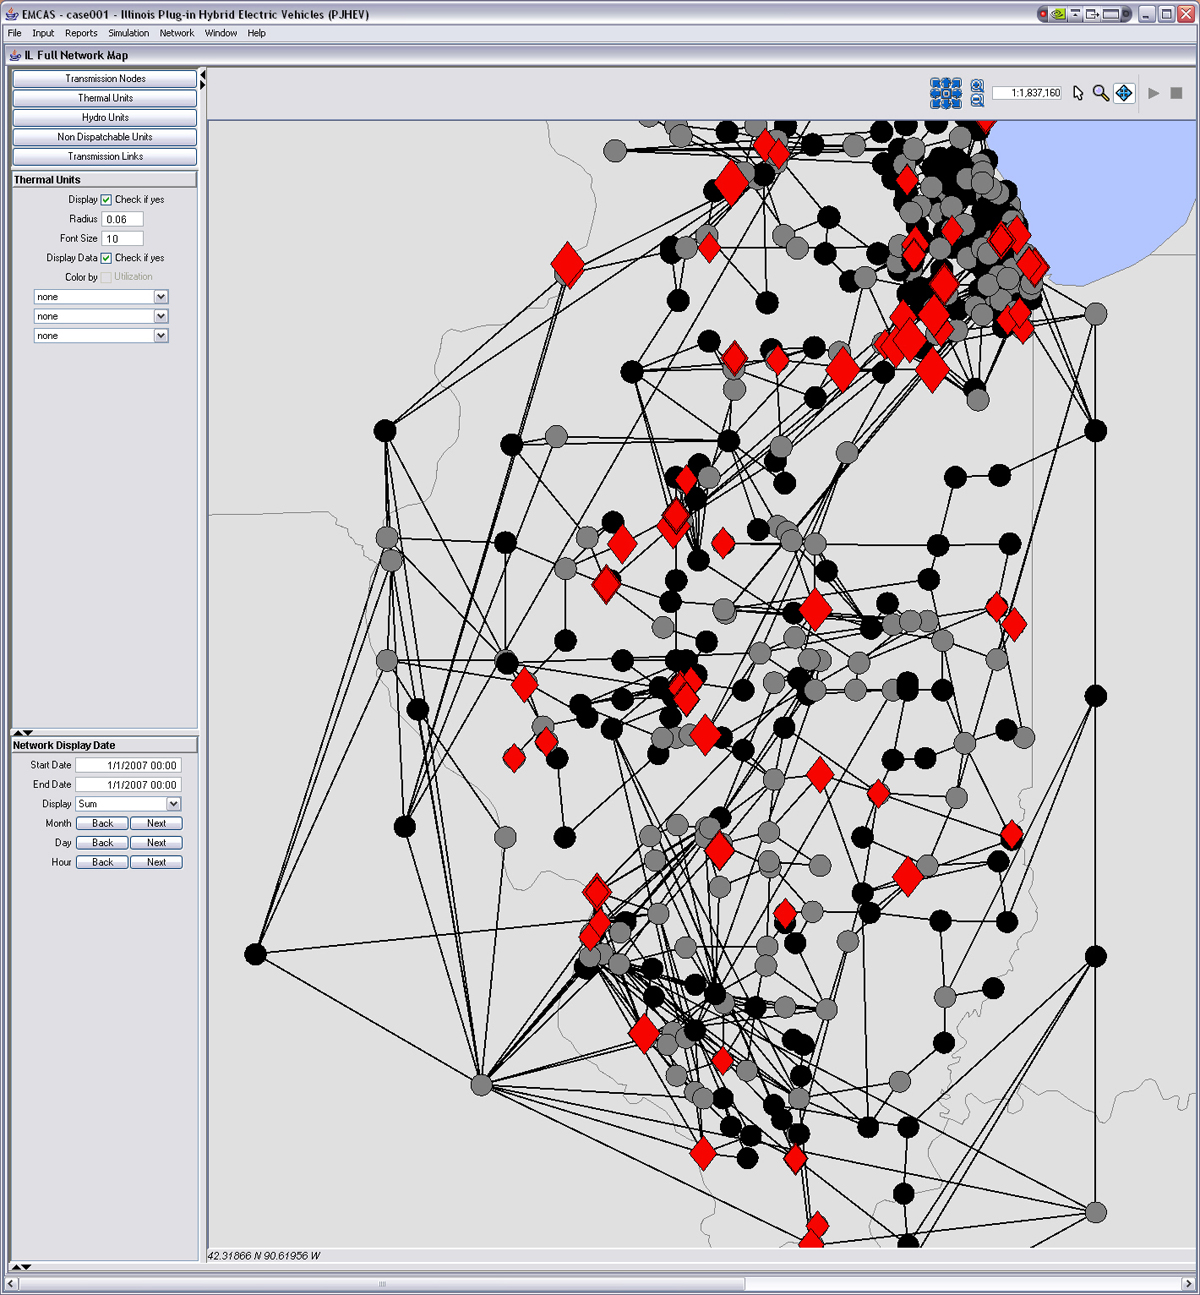
Figure 2: Impact of PHEVs on hourly electricity loads in Illinois, week 32, scenario A (click image for larger version) Price and Dispatch Analysis: We used the EMCAS model to run electricity market simulations with a detailed representation of the power system in Illinois. The base case represents power system conditions for 2007. We included more than 1,800 transmission nodes within Illinois and 52 nodes outside the state. In total, there are more than 2,500 transmission lines and 230 thermal generating units in the data set. EMCAS calculates hourly locational marginal prices in each individual transmission node. We focused on the impact of PHEVs on prices in zones NI-B (representing the northern Chicago area) and AMRN-D (representing southern Illinois), but we also analyzed the changes in system dispatch in Illinois that result from the additional consumption.
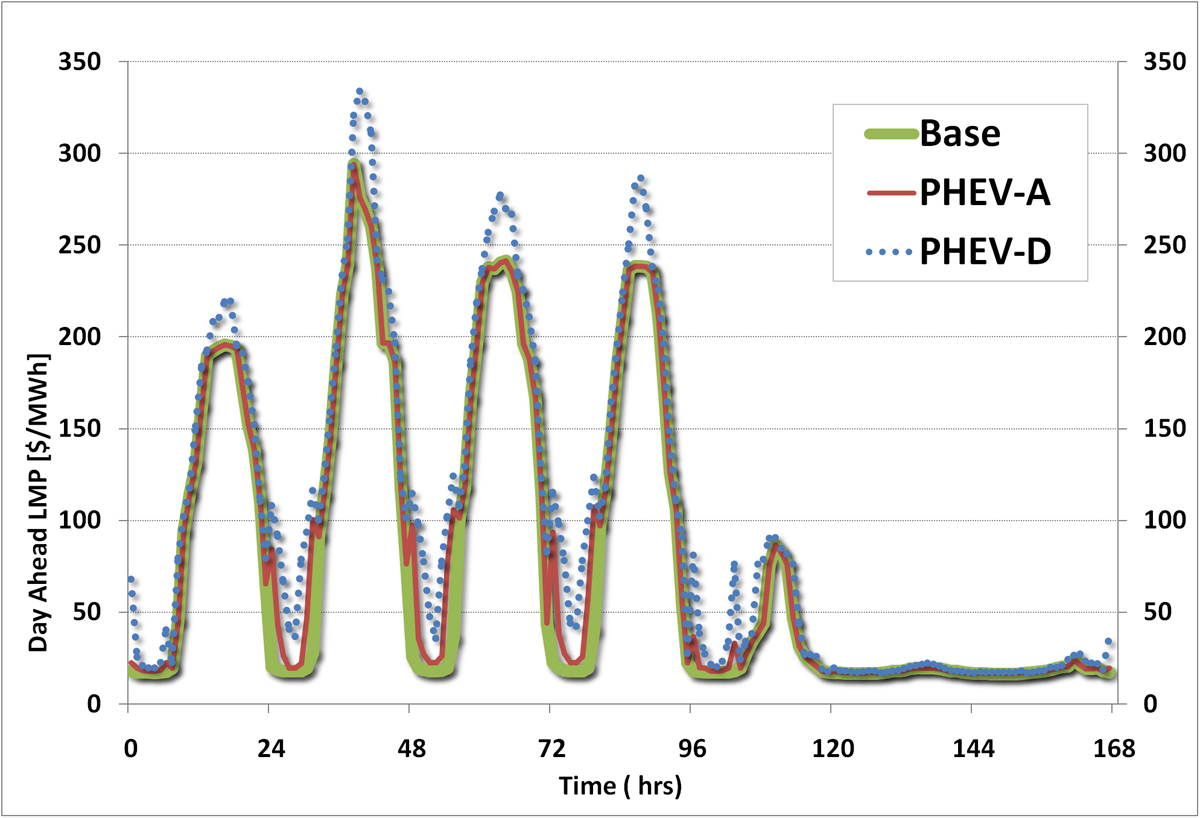
Figure 3: Illinois transmission grid configuration in EMCAS (click image for larger version) Figures 4 and 5 show a moderate increase in night-time prices in the PHEV scenarios during both weeks for zone NI-B. Not surprisingly, the highest increase occurs in scenario D, which has the highest PHEV load. In fact, with the low-load conditions in week 14, we see new price spikes occurring at the time when the PHEV night-time charging starts. The prices during daytime also increase significantly in scenario D, particularly during the high loads in week 32. The impact of congestion in the transmission grid on prices can be analyzed by comparing Figures 5 and 6. The simulated prices in zone NI-B are much higher than those in zone AMRN-D in week 32. This is because of the high load in the Chicago area and congestion in the transmission grid leading into Chicago. Hence, the impact of PHEVs on electricity prices depends on location and will be most distinct in load pockets like the Chicago area.
Figure 4: Simulated hourly electricity prices in zone NI-B, week 14 (click image for larger version)
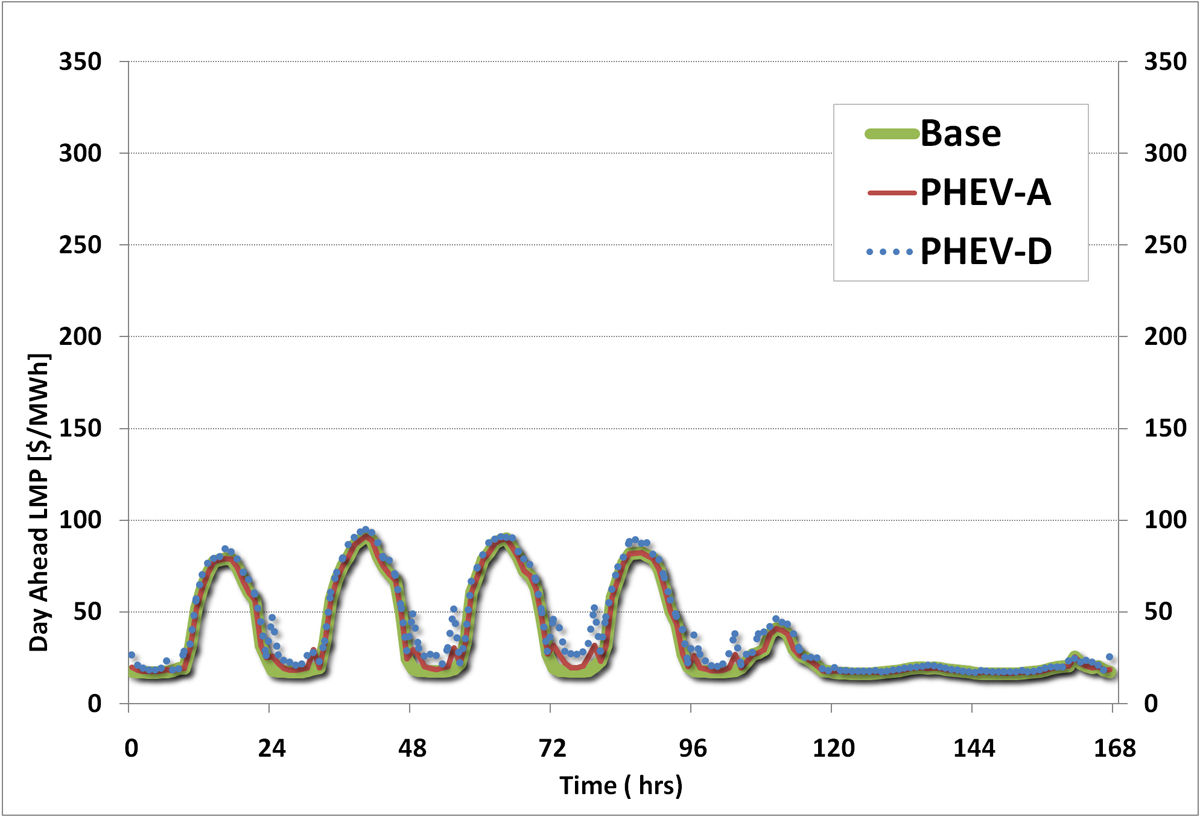
Figure 5: Simulated hourly electricity prices in zone NI-B, week 32 (click image for larger version)
Figure 6: Simulated hourly electricity prices in zone AMRN-D, week 32 (click image for larger version) We also analyzed the change in the dispatch of the power system in Illinois that results from the additional electric loads from PHEVs in weeks 14 and 32. The results are summarized in Tables 2 and 3. In week 14, the increase in load due to PHEVs is almost exclusively met by an increase in coal generation. In week 32, we also see an increase in natural gas-fired generation. Nuclear and hydro generation are constant for the respective weeks because these resources have low operating costs and are therefore dispatched first. An interesting observation is that the amount of imported electricity actually decreases as a function of higher PHEV load, probably because of the large share of baseload nuclear and coal plants within Illinois, which can also serve additional PHEV loads outside of Illinois. Because most of the additional load from PHEVs would be met by coal generation, there would be a substantial increase in CO2 emissions from the power system in Illinois. However, we did not consider future expansion of generation capacity in this analysis. An increase in night-time load caused by PHEVs could result in more nuclear generators being added as base-load generation; this could potentially contribute to a reduction in CO2 emissions from the power sector in the long run. Table 2: Generation (GWh) by fuel, week 14
Table 3: Generation (GWh) by fuel, week 32
Conclusions: Our analysis of the impacts of a potential large-scale introduction of PHEVs on the Illinois power system shows that the load pattern would change considerably in such a scenario. The night-time load would increase substantially. The day-time load could also increase if a significant amount of the PHEV charging takes place during the daytime. This would clearly have an impact on the operations of the Illinois power system. The results of our analysis also showed that the large-scale introduction of PHEVs would have a significant impact on prices. The price changes would depend on the amount of energy required for PHEV charging and the time of day at which charging would take place. In general, the PHEV loads level out the difference between day- and night-time prices. However, the impact on prices varies between regions in Illinois, because of transmission constraints in the power system. Finally, we would like to emphasize that this is an initial analysis of the consequences of PHEVs on the Illinois power system. Our PHEV analysis could be extended in a number of interesting directions, for instance by: (1) looking at the environmental consequences of PHEVs, (2) analyzing how the optimal mix of power generation technologies would change as a result of the additional electricity demand from PHEVs, (3) analyzing in more detail the potential impact of PHEVs on transmission congestion and the need for new transmission lines in Illinois, and (4) calculating the economic impact for the various participants in the electricity market (e.g., generating companies, transmission & distribution companies, consumers).For more information, contact contact CEEESA |

| U.S. Department of Energy Office of Science | UChicago Argonne LLC |
| Privacy & Security Notice | Contact Us | Search |