| Center for Energy, Environmental, and Economic Systems Analysis (CEEESA) |
Research Areas:
Energy, Environment, and
Economics
National and Homeland
Security
Infrastructure Assurance
Emergency Preparedness
Social Dynamics
Policy Analysis
Core Capabilities:
Systems Analysis
Modeling, Simulation, and
Visualization
Complex Adaptive Systems
Decision Support and Risk
Management
Information Sciences
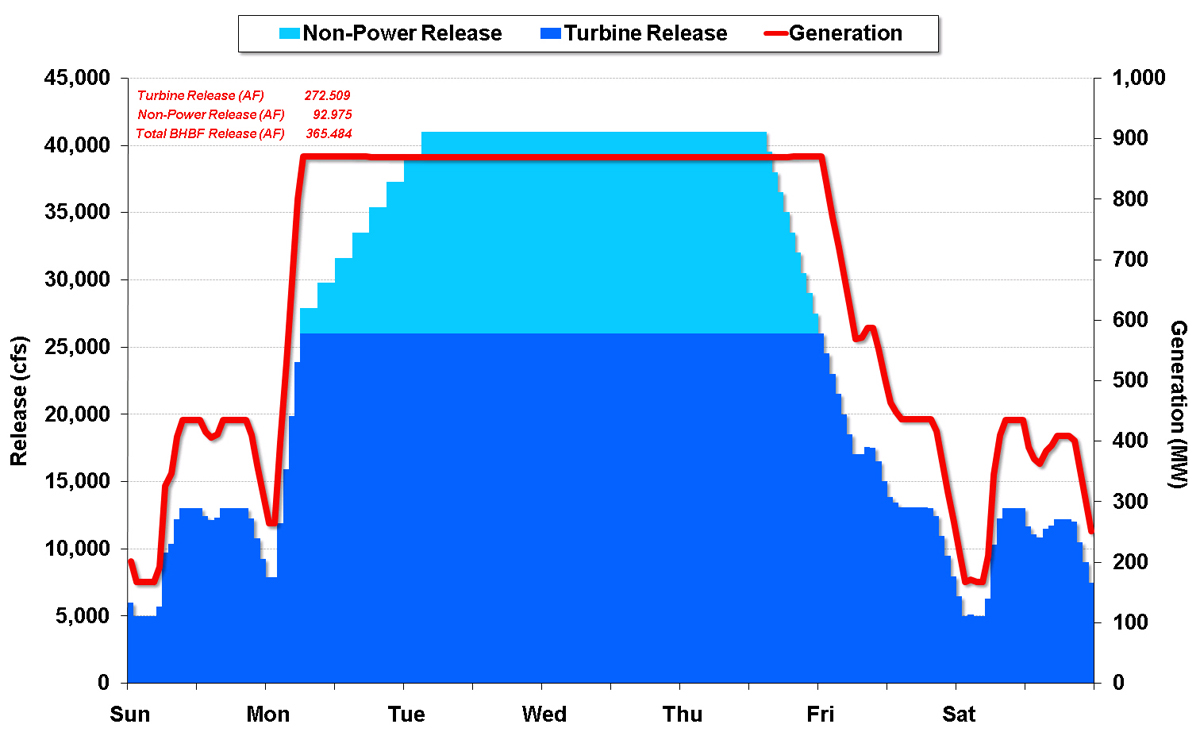
The Economic Cost of the March 2008 Glen Canyon "Flush"Background: On March 5, 2008, the Department of the Interior initiated a 60-hour experiment to evaluate the effectiveness of using high flows from Glen Canyon Dam to improve natural, recreational, and cultural resources in Grand Canyon National Park. The intent was to improve our understanding that higher flows can play in rebuilding eroded beaches downstream of Glen Canyon Dam by moving sand that has accumulated in the riverbed onto sandbars. Operators began increasing flows from the dam on the evening of March 4, with powerplant bypass flows beginning at approximately 10:00 a.m. on the morning of March 5. The water was released through the dam's powerplant and bypass tubes at a maximum rate of up to approximately 41,000 cubic feet per second (cfs) for about 60 hours (Figure 1). The high-flow experiment was conducted by scientists and resource managers from the Department of Interior's Bureau of Reclamation (BOR), the U.S. Geological Survey (USGS), the National Park Service, and the U.S. Fish and Wildlife Service. Energy analysts from Argonne's Center for Energy, Environmental, and Economic Systems Analysis (CEEESA) were asked to help the Western Area Power Administration (Western) provide insight into the economic cost of the experiment. Costs are a function of (1) releasing water from the dam that otherwise would have been used for power generation at a later time solely for the purpose of rebuilding beaches and habits in the canyon and (2) releasing water for the experiment to generate power during the night when market prices are relatively low, rather than during the day when market prices are high.
Methodology: The methodology used by CEEESA and Western to estimate the economic cost of the March 2008 high-flow release experiment, or Beach/Habitat Building Flow (BHBF), at Glen Canyon Dam was based primarily on a BOR January 2008 24-month study and hourly simulations of the Salt Lake City Area Integrated Project (SLCA/IP) hydropower plant operations. In that study, BOR is projecting hydrological conditions and reservoir operations in the Colorado River Basin for a 2-year period based on initial conditions in the basin and forecasts of future inflows. The RiverWare model was used as the main tool for projecting future basin hydrology. The 24-month study is updated monthly to reflect evolving basin conditions. Study reports are posted on http://www.usbr.gov/uc/water/crsp/studies/index.html. In our study, economic costs were computed as the difference in Western’s net expense to serve load between the two cases: with BHBF and without BHBF. The Reference Case, without BHBF, was based on monthly water release projections provided in the January 2008 24-month study. Hourly SLCA/IP operations in the Reference Case were simulated by using Argonne's Generation and Transmission Maximization (GTMax) model, which complies with all physical and environmental limitations, including the 1997 Environmental Impact Statement (EIS) Record of Decisions (ROD) at Glen Canyon Dam. In the BHBF Case, a relatively large amount of water was released from the Lake Powell Reservoir compared with the Reference Case. Therefore, compared with the 24-month study, water releases for several months of the year had to be reallocated from other months of the year to support high BHBF flows. To capture the effects of monthly BHBF water reallocations on the economics of the SLCA/IP system, the analysis was performed over a 1-year period. As in the Reference Case, hourly simulations in the BHBF Case had to comply with all physical and environmental limitations, including those specified by the Glen Canyon Dam ROD.
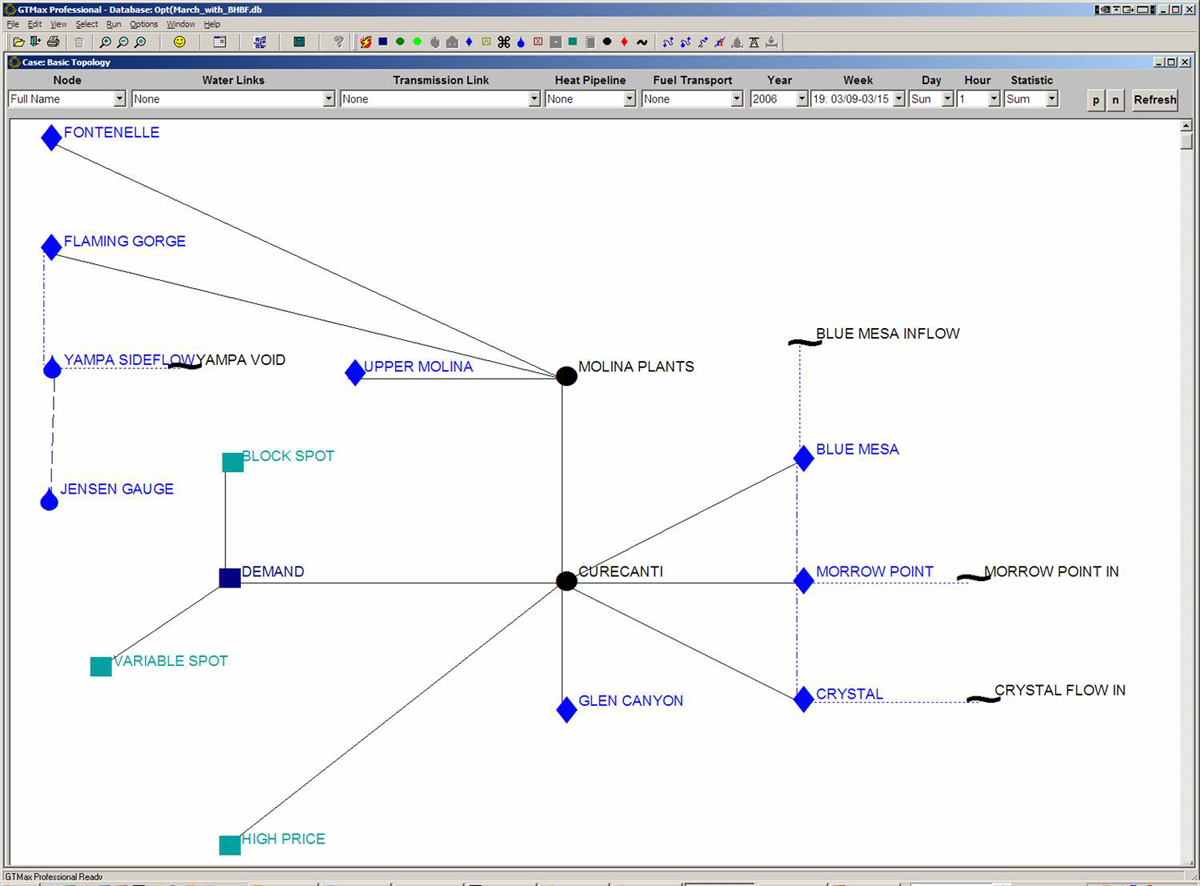
Simulations of Hourly Operations: Hourly simulations of the SLCA/IP system were based on the GTMax model utilizing the pre-scheduling topology that was specifically designed for Western’s Marketing Office in Montrose, Colorado. As shown in Figure 2, this topology was used to formulate plans for future power purchases. The topology contains a nodal representation of hydropower plants, loads, and power market energy transactions. Links in the model represent the flow of energy from generation resources and market purchases to serve load and for sale to non-firm markets. Links also represent water channel flows from sources to sinks. Hydropower plant nodes contain information about reservoir water releases and power plant constraints specified at weekly, daily, and hourly time scales. Where applicable, the model also traces and limits reservoir elevation levels and downstream flow rates. Key results from the economic analysis include hourly SLCA/IP generation, non-power water releases, and hourly power market transactions. Hourly SLCA/IP plant-level simulations were performed for one typical week per month during the study period (2008). In the BHBF Case, one additional weekly run was performed to simulate operations during the BHBF. Operations were, in part, dictated by monthly projections of reservoir elevation levels and water release volumes given by the BOR 24-month study. Reservoir elevations influences the conversion of turbine water release to electricity generation and the maximum output capability of the plant. Glen Canyon Dam monthly water releases for both scenarios are shown in Table 1. Note that in the BHBF Case, monthly releases were relatively high, at 830 thousand acre-feet (TAF) in March, compared with the Reference Case at 600 TAF. On the other hand, the BHBF case had relatively low releases from April through September. The higher release in March in the BHBF case resulted in a lower end-of-month (EOM) reservoir elevation, about 2.6 feet, compared with the Reference Case. Elevation differences declined over time as less water was released in the BHBF Case in the summer months. Note that by the end of September, elevations were identical under both cases. Lower forebay elevations at the Glen Canyon Dam Hydropower Plant resulted in a slightly smaller power conversion factor; for example, in March, the conversion factor decreased by 0.00246 megawatt-hour per acre-foot (MWh/AF) from 0.40811 MWh/AF in the Reference Case to 0.40565 MWh/AF in the BHBF Case. Power conversion factors for the two scenarios were identical by the end of September. Table 1: Glen Canyon Dam monthly releases
Hourly BHBF at Glen Canyon: The total release during the BHBF week in March 2008 was about 366 TAF. Most of this release, about 274 TAF, was used to produce electricity. However, 93 TAF of water was released through bypass tubes in order to meet the BHBF mandate of a constant release rate of 41,000 cfs over a 60-hour period. If the non-power releases had been used for power generation at a later time, Glen Canyon could have produced an additional 38 GWh of energy. An additional 3 GWh was lost as a result of the loss in head that was projected to occur from March through September. As shown in Figure 3, an hourly up-ramp rate of 4,000 cfs was allowed until Glen Canyon produced at power plant capacity, i.e., about 869 MW at a turbine flow rate of 26,000 cfs. Above that level, bypass tubes were opened. According to the BHBF flow specifications, bypass tubes were opened one at a time in increments of 50 percent of bypass capacity every 3 hours until a flow rate of 41,000 cfs was reached. After 60 hours of releases at 41,000 cfs, releases ramped down at a rate of 1,500 cfs per hour. Both up-ramp rates and down-ramp rates during this period were consistent with Glen Canyon Dam ROD constraints. These BHBF specifications resulted in generation at power plant capacity for about 91 continuous hours. As shown in Figure 4, this was above load, and excess generation was sold in the non-firm power market. After subtracting releases during the BHBF week from the monthly total of 860 TAF, during the remaining weeks in March, an average of 135 TAF per week is released. Consistent with ROD constraints, a daily change of 8,000 cfs is allowed during all non-BHBF days in March. Other SLCA/IP Hydropower Plants: Using an integrated systems approach, the GTMax model simulated SLCA/IP hydropower plant operations over a one-week period (i.e., 168 hours) such that the economic value of the entire system is maximized. In both cases, monthly water releases and reservoir elevations for all SLCA/IP facilities other than Glen Canyon were assumed to be identical to levels given in the BOR 24-month study. These facilities were also included in the GTMax topology shown in Figure 2, because they respond to changing operations at Glen Canyon Dam. GTMax optimization of these facilities included interactions among the reservoirs in the Aspinall Cascade. The model also insured that the flows at the Jensen Gauge 50 miles downstream were within allowable rates. Gauge flows were computed by using both GTMax and the Streamflow Synthesis and Reservor Regulation (SSARR) model. To compute Jensen Gauge flows, GTMax used a Water Time Travel Distribution (WTTD) function that was derived from SSARR simulation results. For hydropower plants, such as Upper and Lower Molina, that were not included in the 24-month study, median hydrological conditions computed from PO&M-59 historical data were input into GTMax. Other SLCA/IP power plants, such as Elephant Butte, were not in the GTMax topology. Instead, anticipated generation from these facilities was subtracted from Western’s Long-Term Firm (LTF) loads before the data were input into GTMax. Power Market Prices: Market prices for February 2008 through December 2008 were based on Energy Market Report (EMR) futures prices published on January, 25, 2008. Prices for January 2008 were based on currently observed prices. Monthly on-peak and off-peak prices are shown in Table 2. Table 2: Assumed market prices
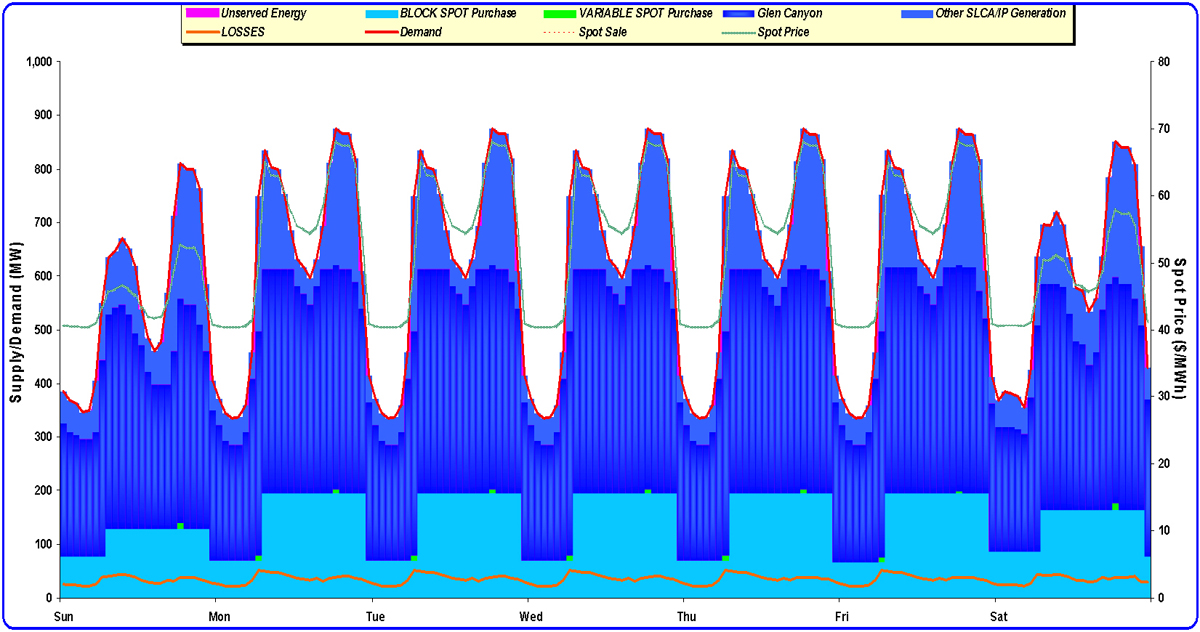
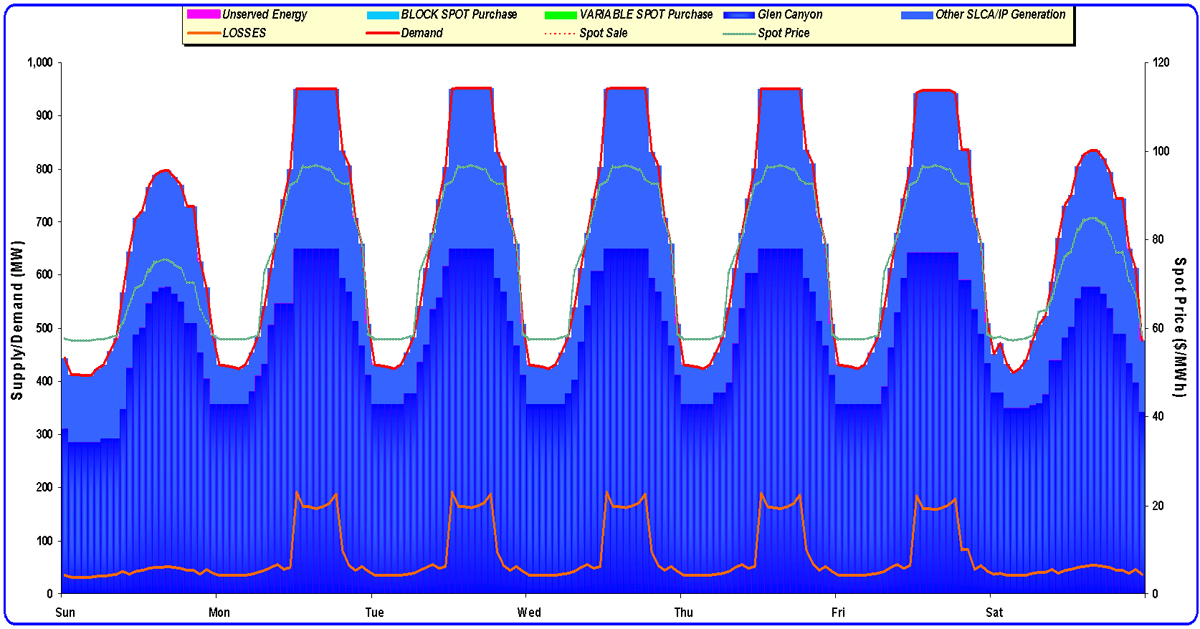
Hourly Firm Customer Load: The loads entered into GTMax included LTF loads and project use loads. Estimates of Western’s future loads were based on historical hourly load profiles that were collected by staff in the Montrose (Colorado) office. Loads input into GTMax were processed to create typical shapes for three types of days, including a weekday, Saturday, and Sunday. Typical profiles for each type of day were developed using average values for specific hours. For example, the typical load for 1:00 a.m on a weekday in January was based on the average of all 1:00 a.m loads during weekdays in that month. As described above, loads input into GTMax were adjusted for generation produced by SLCA/IP facilities excluded from the model’s topology. Dispatch and Market Transaction Rules: Load is served first by SLCA/IP power production. When these resources are inadequate to meet the entire load, market purchases are made in 8-hour off-peak blocks and 16-hour on-peak blocks. If hydropower operational flexibility is inadequate to follow firm load fluctuations, variable spot market purchases are made as a last resort. Sales to the power market are typically made only when SLCA/IP generation in a month exceeds load. To the extent possible, sales are made during on-peak hours when prices are relatively high. As a general rule, Western does not purchase power during off-peak hours for the purpose of on-peak sales. Figures 5 and 6 show examples of operations and power market transactions during energy-short (January 2008, Reference Case) and energy-long (July 2008, Reference Case) months.
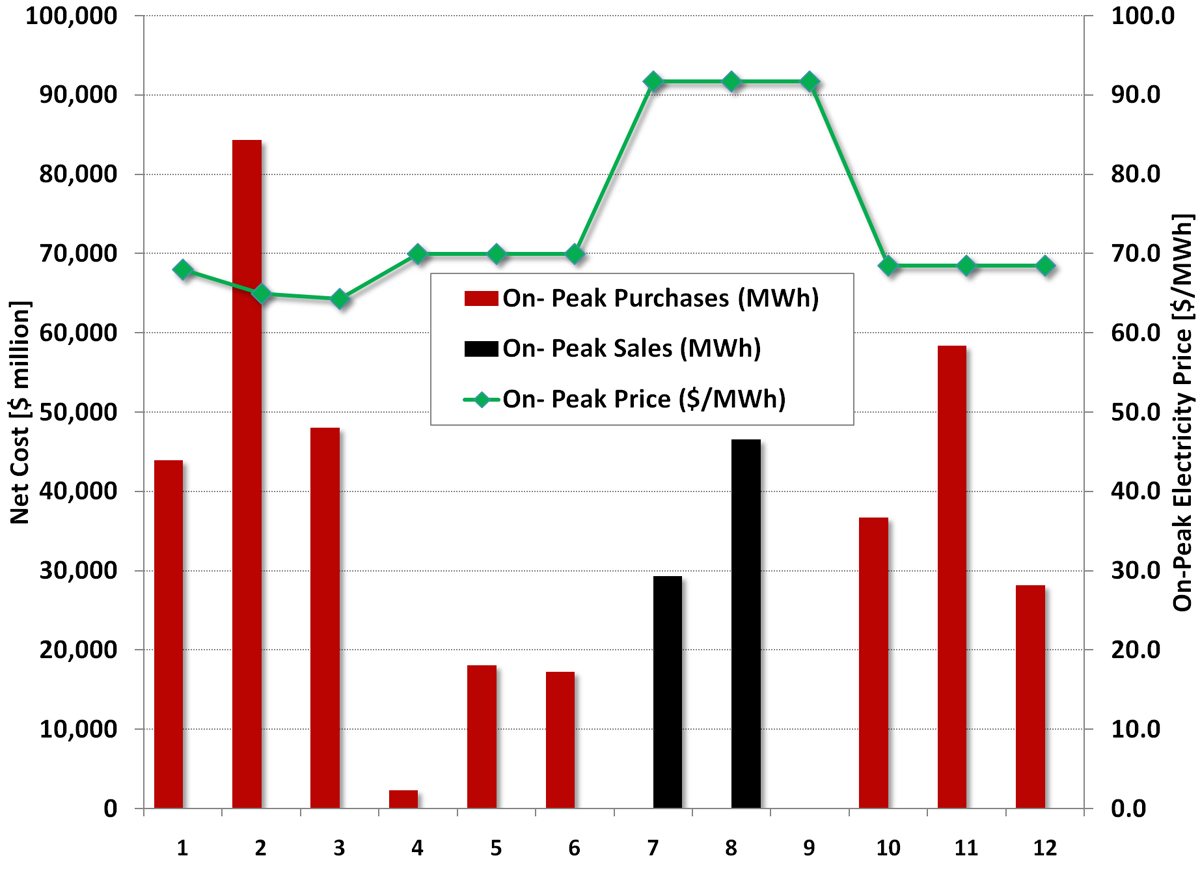
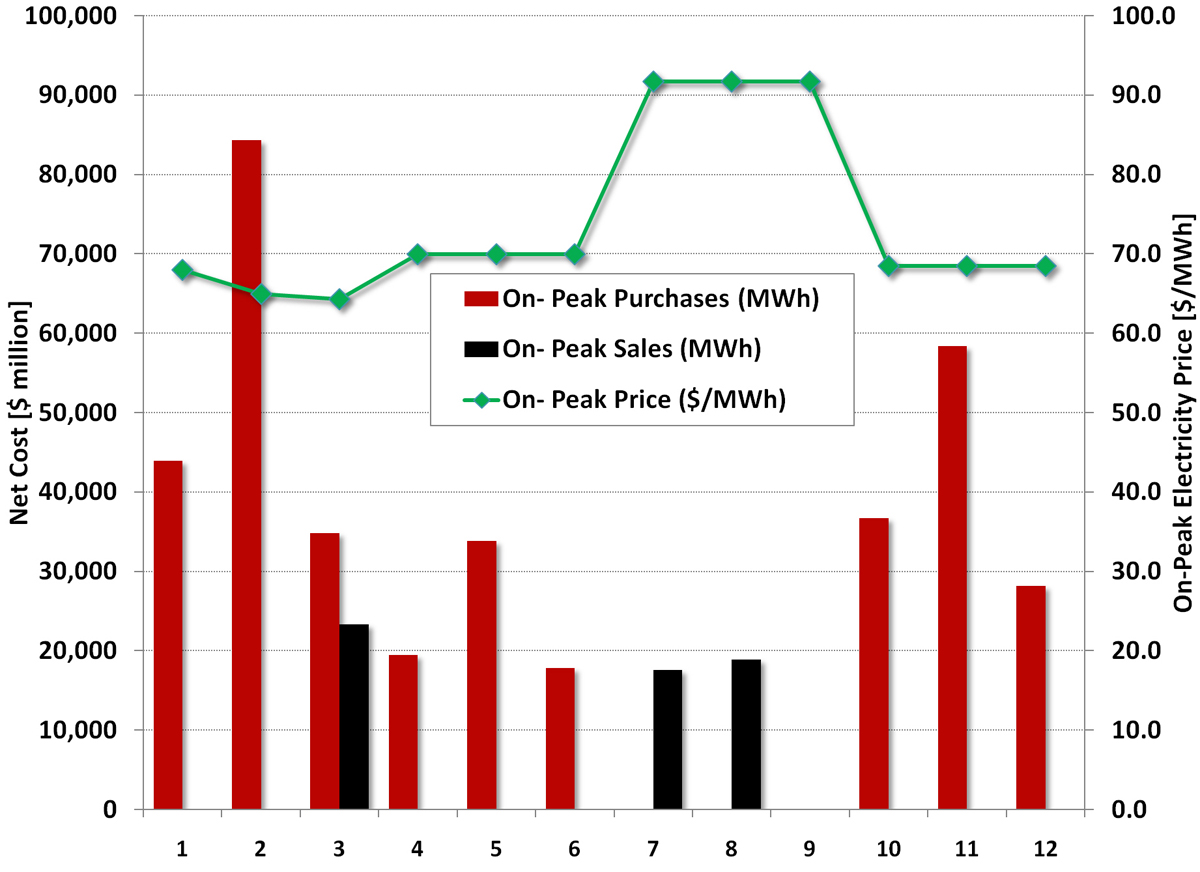
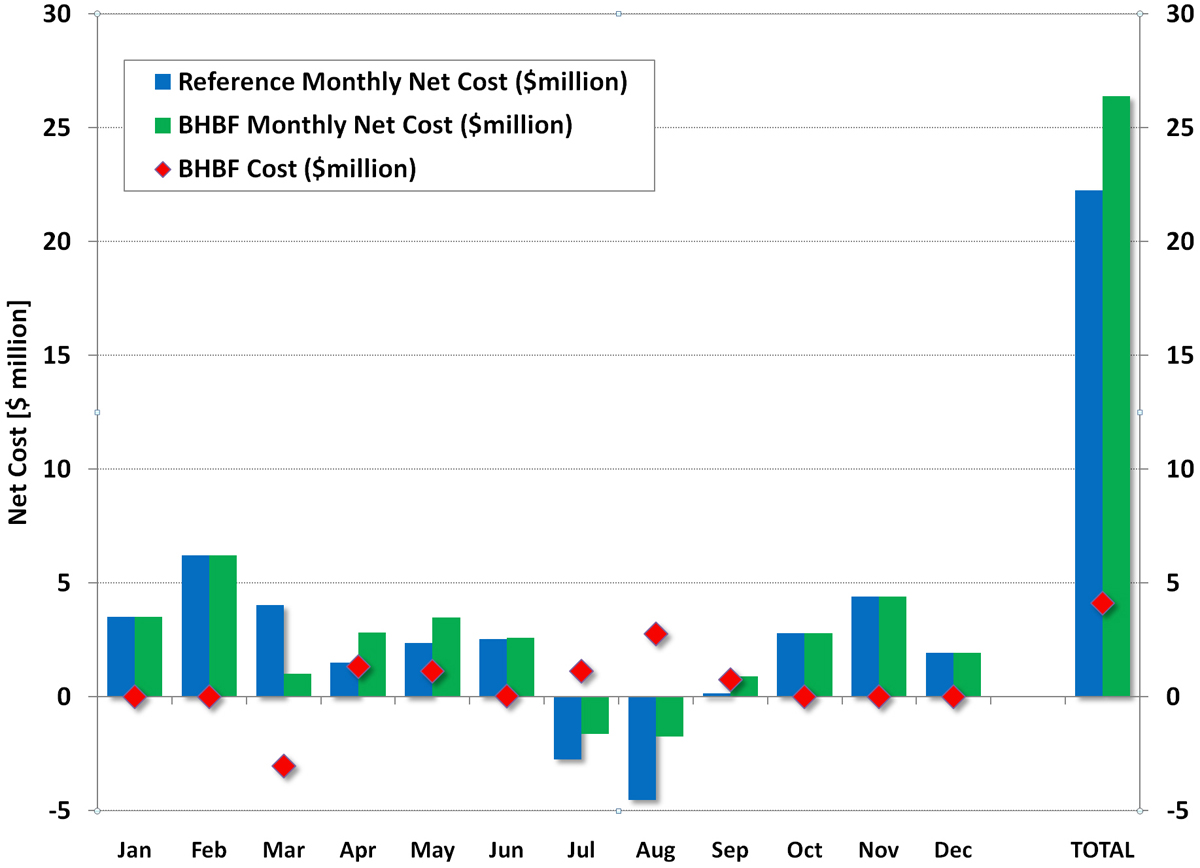
Economic Costs: Figures 7 and 8 show the simulation results for all of 2008 under the Reference Case and the BHBF Case. Under the Reference Case, on-peak purchases are made in all months, except for July and August, when hydro generation is higher than customer loads and Western has significant excess energy for on-peak sales. Under the BHBF Case, higher hydro generation in March leads to lower on-peak purchases and on-peak sales when the spike flow occurs. During other times in March, on-peak purchases under the BHBF Case are similar to those under the Reference Case. Sales in summer under the BHBF Case are reduced because less water is available for power generation in those months. Figure 9 shows the resulting economic costs under both scenarios, as well as the incremental cost related to the BHBF experiment. In March, there is a negative cost (or a net benefit) as a result of the increased generation and sales (and reduced purchases). The other months in the table show that the BHBF experiment has either a positive net cost when water releases and forebay elevations are lower or no cost when monthly water releases and reservoir elevations are projected to be the same under both scenarios. The total economic cost over the entire year of the BHBF experiment (Glen Canyon "Flush") is estimated to be $4.13 million.
Figure 7: GTMax results for Reference Case, on-peak purchases, on-peak sales (click image for larger version)
Figure 8: GTMax results for BHBF Case, on-peak purchases, on-peak sales (click image for larger version)
Figure 9: GTMax results for monthly and total costs under both scenarios, as well as BHBF-related cost (click image for larger version) Additional Resources: For more information on this analysis, download the following documents (in pdf format):
For more information, contact contact CEEESA |
||||||||||||||||||||||||||||||||||||||||||||||||||||||||||||||||||||||||||||||||||||||||||||||||||||||||||||||||||||||||||||||||||||||||||||||||||||||||||||

| U.S. Department of Energy Office of Science | UChicago Argonne LLC |
| Privacy & Security Notice | Contact Us | Search |