What's New in ENPEP-BALANCE Version 2.20
ENPEP-BALANCE Version 2.20 includes a variety of new features, such as price-elastic demands, fully integrated economic cost calculations, increased maximum number of nodes, new custom reports, enhanced error reporting, improved speed through direct memory allocation, improved database backup routines, added interface features, and more. The following shows the latest software changes and upgrades from Version 2.15g to Version 2.20.
SYSTEM, DATABASE, AND FILE MANAGEMENT FEATURES:
Regional Settings: For ENPEP-BALANCE to work properly, the regional settings on your computer must be set to English (United States) with a point as decimal symbol instead of a comma. The regional settings can be found in the Windows Control Panel. ENPEP-BALANCE now checks the regional system settings for the number and date format, and issues a warning if your current setting is not set to English (United States).
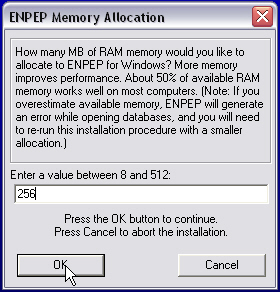
Physical RAM Allocation: During the model installation, you now have the option of allocating a portion of the physical RAM to ENPEP-BALANCE. Typically, we recommend using about 50% of the actual RAM of your computer for ENPEP-BALANCE. For example, on a PC with 1 GB RAM, the best amount to use is 512 MB. Memory will be allocated only when you start the
ENPEP-BALANCE model and will be released when ENPEP-BALANCE is closed. Memory allocation makes the model significantly faster – the more RAM you allocate, the faster your case runs. Our experience shows that allocating 50% of your RAM will essentially cut the run time in half.
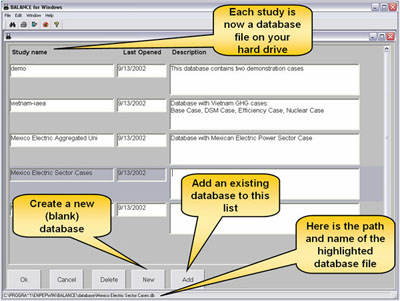
New Database Management System: ENPEP-BALANCE now has a new database management, backup, and recovery routine. Instead of relying on only one database (enpepwin.db) as in earlier versions, version 2.20 now allows you to keep your cases in different databases. In fact, the databases replace the studies used in previous versions. Each database can be thought of as a study. Each database will be backed up at regular intervals set by the user under “Run Parameters.” This design change significantly reduces data loss in case of power outages or system crashes.
INTERFACE FEATURES - NEW ICONS:
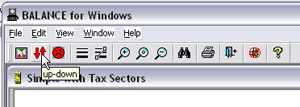
We added icons in the toolbar for the execution of the up-down routine (determines the calculation sequence during the simulation) and the actual
ENPEP-BALANCE simulation. The "up-down" icon color changes from black to red if the network structure has changed, that is, if you added or deleted any nodes or links. If the icon is red, you should execute the up-down routine.
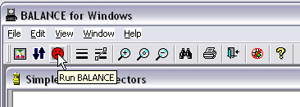
The "Run BALANCE" icon color changes from black to red if you modified any input data. If the icon is red, this may indicate that your input data are not consistent with the results displayed in the interface and that you should run the
ENPEP-BALANCE simulation again.
MODELING METHODOLOGY AND ALGORITHM:
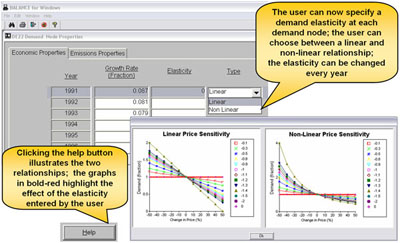
Price-elastic Demands: We have now implemented price elasticities at the demand nodes. You can choose from two price-demand relationships: linear and nonlinear. An interactive help feature quickly illustrates how the elasticity you specified will affect the model results.
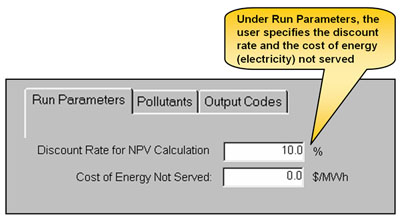
Economic Cost Calculations: The economic cost calculation (NPV) is now fully integrated into the model. Additional inputs to run the NPV calculations can be found in the “Run Parameters.” You need to specify the discount rate to be used when calculating the net present value of the total economic system costs as well as the cost of energy (electricity) not served. Please contact us for more details and/or the manual for the NPV calculations.
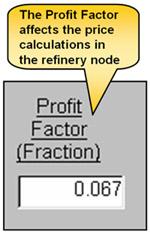
Refinery Profit Factor: We introduced a profit factor to the multiple output (refinery) nodes. Specifying a profit factor will change the prices of all process output products. Please consult the manual or the appropriate training materials for more details on the price calculations.
Increased Network Dimensions: We removed most size limitations for network design. The model dimensions, i.e., the number of nodes in the network, have been significantly increased. Now, you can have up to 999 nodes of each node type in
ENPEP-BALANCE, with a total number of links of 999.
NEW REPORTING FEATURES:
We added several new reporting features to the model:
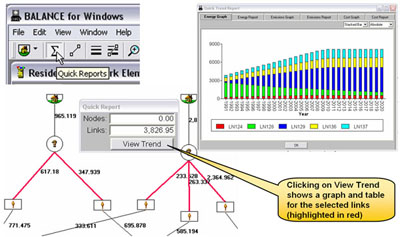
New Quick Report: The first new report is the Quick Report. You will find this feature particularly useful during the initial case debugging and verification stage as it allows you to quickly compare model results with historical statistics. You start the quick report by clicking on the sigma icon in the tool bar. To debug energy flows, please make sure you first select “Quantities” as link overlay. The report works the same for emission results. In this case, please first select “Emission” as node overlay. To use the feature to verify energy results, you click on individual network links to include them in the report. Selected links are highlighted in red (clicking a link again will de-select it). The report window shows the sum of energy flows on all selected links for a given year.
ENPEP-BALANCE automatically updates the value in the pop-up window as links are added to (subtracted from) the report. Click on “View Trend” to see a graph for the selected links over the entire study period. Graphing options include lines and stacked bars (absolute and 100%). You can also look at the results in tabular format and even export the values to a text file for post-processing in Excel.
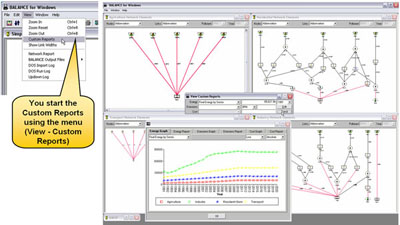
New Custom Report: Another new report type is the Custom Report. You will find this feature particularly useful for the final stages of your analysis or result reporting, as it allows you to easily set up standard reports, such as final energy consumption by sector or fuel type, primary energy supply, power sector fuel consumption, and emissions by sector and fuel type. Custom Reports are similar to the Quick Reports. One difference is that Custom Reports are permanently stored in the database, while Quick Reports are temporary reports and not saved anywhere unless you export the results to a text file. Also, Custom Reports are more flexible in the way you can configure them. You define the reports under “Edit – Custom Reports.” You start the Custom Reports under “View – Custom Reports.” A pop-up window appears that allows you to select either an energy report, an emissions report by pollutant, or a cost report. If the report you want to view spans more than one sector, the model opens all sectors that are part of this report, highlights the links, and shows the total for a given year. Click on “Trend” to see a graph for the entire study period. Graphing options include lines and stacked bars (absolute and 100%). You can also look at the results in tabular format and export the values to a text file for post-processing in Excel.
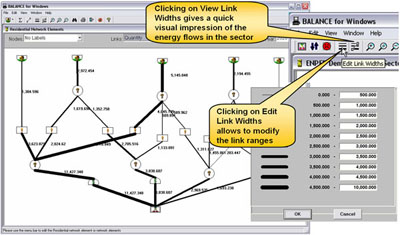
New Link Display: A new interface feature allows you visualize energy flows on the network links, that is, links are displayed by using different link widths. Links with large energy flows are displayed with thick lines, while links with small flows are displayed with thin lines. This feature is designed to help you more easily verify model results and present graphical results.
Improved Error Reporting: We substantially improved model error reporting. The number of errors reported has increased noticeably, and all errors are now clearly identified by sector, node, and error type. This allows you to more quickly pinpoint potential problems with the network configuration or your model input data.

Improved Input Data Validation: In connection with the improved error reporting, we expanded the validity checks for all model input data. Valid data ranges are now defined for all input fields. and warnings are issued if you enter values that are outside the range. Also, in case you add nodes to the network but forget to enter input data, ENPEP-BALANCE now issues a list of the minimum input data that are required to execute the model.
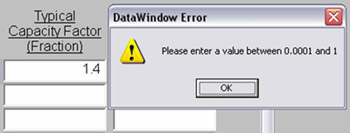

Code Corrections: Several code corrections were made with regard to electric units, input limitations or valid data ranges for input fields, and the case import and export routines. Please contact us if you need more details on these corrections.
Transition from Version 2.15 or Earlier: If you transition from 2.15 or an earlier version to 2.20 and you have more than one study in your database, follow the procedure below:
(1) If you are currently running Version 2.15, we STRONGLY recommend that before installing Version 2.20, you first export all your cases from your current 2.15 database to individual case files (extension *.cas). The reason is that the database structure has changed significantly from 2.15 to 2.20 and that the old databases will be difficult to run under Version 2.20.
(2) Rename the current ENPEP folder from C:\Program Files\ENPEPWIN to C:\Program Files\ENPEPWIN215. This will provide an extra safeguard to protect your existing ENPEP database (enpepwin.db).
(3) Double-click on the installation file for Version 2.20.
(4) Choose the location where you want to install the software (default location is C:\Program Files\ENPEPWIN).
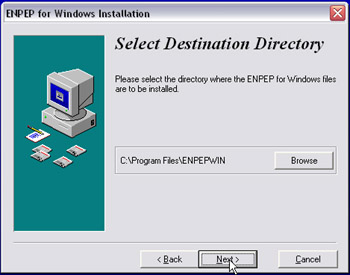 (5) Enter a value for memory allocation as described above. (5) Enter a value for memory allocation as described above.
(6) Start ENPEP-BALANCE
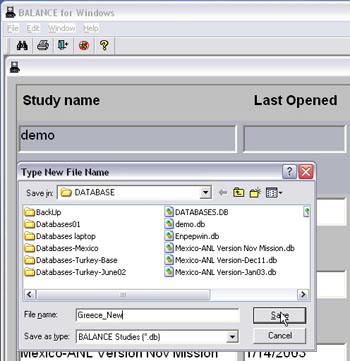
(7) To import your old 2.15 case files, create a brand new, empty database. We recommend you create more than one new database to organize your cases. To create a new database, click on NEW in the study screen. A window will pop up where you can enter the name of the new database and also specify the location of the new database.
(8) You can now open the
new database. At this point, it will contain no cases.
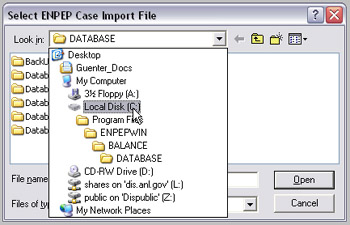
(9) Go to File – Import Case to import your version 2.15 case.
(10) In the following window, you need to specify the location of the *.cas file.
(11) The software will now import the case.
Additional Resources: For more information on the model and the latest modifications and upgrades, download the following brochures, presentations, papers, and reports in pdf format:
The model is now available for free to everyone. Please send us an email if you want the latest
version of the software.
For more information, contact contact CEEESA |


 (5) Enter a value for memory allocation as described above.