Power Market Simulator
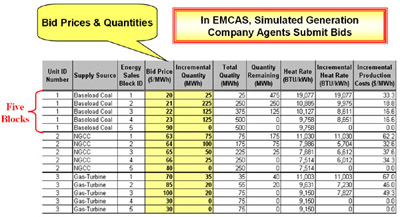
The power market simulation can be run in either a spreadsheet environment or within CEEESA's Generation-Transmission Maximization (GTMax) model. While in the simulator, real people represent power generation companies submitting hourly generation bids into a virtual market, in CEEESA's Electricity Markets Complex Adaptive Systems (EMCAS) model, simulated agents submit these bids. Bids are submitted for 24-hour periods (day-ahead market) and entered into the model. The software is then run to determine market clearing prices, generation levels for all units, and profits/losses for each market participant. Before starting the simulation, each participant is provided with a set of "market rules" that have to be followed by each player.
Objective: The objective of the simulation or "game" is for each player to maximize his/her profit by selling electricity into the market. The player with the highest profit wins the game. If no one makes money, the player with the lowest loss is declared the winner. Net profit is calculated based on energy sales in each hour, real-time market clearing prices, incremental production costs for each block of each generation unit, energy production of each block, fixed O&M costs, and fixed capital charges
Market Bid Submissions: Players must make power related decisions independently and all energy bids are private, that is, collusion is not allowed. Simulations can be run with collusion allowed to test the potential for market manipulation. Each player/generation company submits his/her bids in subsequent bidding rounds for a virtual week of market operation. Bids are submitted for each hour in 24-hour blocks in form of spreadsheets provided by course instructors. The bids must conform to the following rules:
- Submissions must be made prior to the deadline posted on the public bulletin board,
- The total of all energy bids submitted by a player may not exceed the operational capability of on-line generating units that she/he owns,
- There are a maximum of five bid blocks per unit,
- Bid block sizes are determined by the player as part of her/his bidding strategy,
- The sum of all five bid blocks may be less than the total generating capability of the unit,
- A bid block size of zero MW is allowed, and
- Bid prices for each unit must increase as a function of block number; that is, the bid price for the second block must be more expensive than the first, the third block is more expensive than the second, etc.
Power Plant Resources: Each player is provided with three virtual generating units consisting of the following:
- one 500-MW coal-fired power plant,
- one 250-MW natural gas combined-cycle, and
- one 75-MW natural gas-fired combustion turbine.
The costs and characteristics of each of the above units are contained in the bidder's spreadsheet. The production cost for each bid block is based on third-order polynomial heat-rate curves contained in the provided bid spreadsheet. Block-level incremental heat rates and incremental production costs are based on these curves and are automatically computed by the spreadsheet for user defined bid blocks. For simplicity, it is assumed that all units have a zero minimum generation level and no ramping restrictions.
Random Outages: Units are subject to random outages. The duration of an outage is exactly 24-hours and an outage begins and ends at midnight. Outages are posted on the public bulletin board the next day. Outages are not known prior to the submission of bids. The real-time market-clearing price may or may not be effected by outages depending on demand levels.
Demand Projections: The historical peak load of 4,150 MW occurred last year. Loads have been about 2.5% higher than last year. Loads everyday follow a weekday pattern. Both day-ahead weather and electricity demand forecasts for minimum and maximum levels are posted on the public bulletin board (i.e., Bulletin Board.xls) that is publicly available. A typical weekday load profile is also provided. Forecasts are imperfect and loads may be either higher or lower than the previous day’s prediction. Load forecasts are based on the predicted temperature and a historical relationship between temperature and loads. These relationships are provided to all players. Load forecasts are subject to two types of errors:
- Temperature forecast have a 3.5 F standard error of estimate for the maximum temperature and a 3.0 F standard error of estimate for the minimum temperature, and
- Factors that are not accounted for in the temperature/load forecast equation. Given a perfect temperature forecast the standard error of estimate for the peak load forecast is about 60 MW and the standard error of estimate for the minimum load forecast is about 55 MW.
The above two sources of error may either compound or tend to negate each other for the final load forecast.
Buyers of energy may curtail some purchases when the market-clearing price is above various threshold levels. The higher the price the greater the curtailment level. Demand curtailments and unserved energy levels are post on the public bulletin board prior to the next day bidding deadline.
Random Event Module: The random outage module serves several functions -- all of which are designed to mimic the uncertainties that exist in the “real world.” These roles are as follows:
- Produces the actual real-time weather,
- Produces actual hourly loads, and
- Causes unit outages.
Independent System Operator (ISO): The ISO determines real-time market clearing prices for each hour of the day by finding the supply and demand intersection point. The ISO will place hourly market clearing prices for the previous day on the bulletin board along with actual loads.
The ISO will provide individual players with the bids that were accepted. The ISO will also compute the financial performance of players at the end of each simulated day and will send the results to players. Accepted bids and financial performances of individual players are kept private until the end of the game.
Additional Resources : For more information on the market simulator and its application, download the following brochures, presentations, and papers in pdf format:
For more information,contact CEEESA. |
